It covers the basics – organizing your layers and preferences, plugin use, and using geopotential height forecasts for early spotting of long-distance flight opportunities.
Drop me a line if you find errors, or have suggestions for improvement.
selecting between accuracy and speed: using the ‘Layer Interpolation’ switch
Let’s go through these in turn:
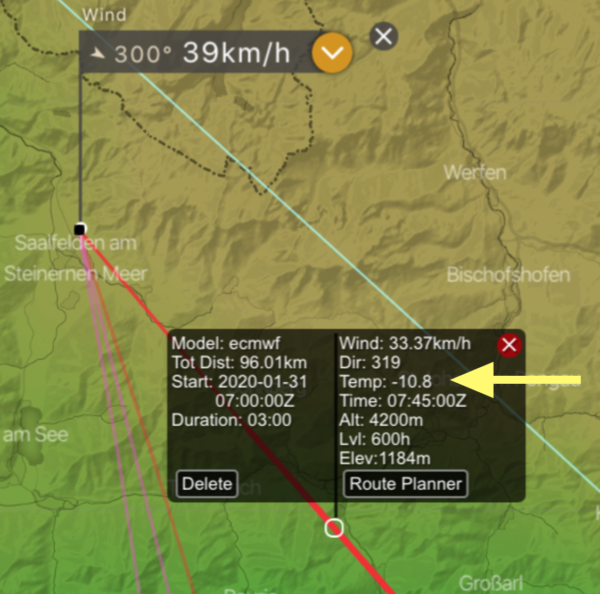
Temperature along a path
Once you have created a path, click on a point along the track. The popup shows the forecasted temperature at this location – useful for the loading calculation, and planning proper clothing:
the outside air temperature displayed along the path
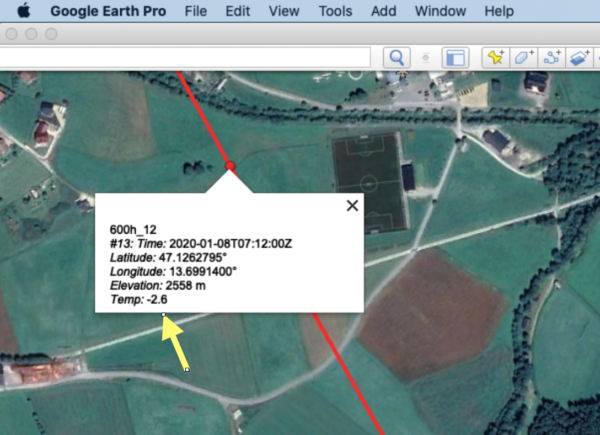
Tracks downloaded as KML or GPX files will carry along temperature values except for ECMWF-generated tracks. You can see the temperature forecasts in windy, but due to licensing constraints the values are not exported for ECMWF.
Not every program which reads GPX files actually can display these values. Barring a better alternative, exporting in KML and reading in Google Earth will display temperature values:
Google Earth will show temperature values when importing a windy-traj generated KML file
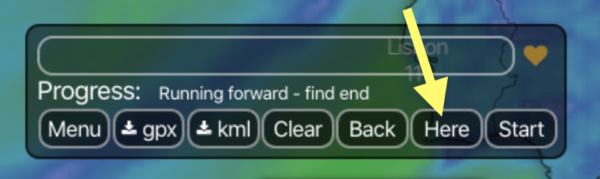
Here: warp me to where I am!
On a recent balloon ride we had to decide wether to rise, descend, or stay level to reach a certain target. Since we had mobile Internet coverage, we used windy to re-generate trajectories for different altitude choices.
As always, you need a starting location. So that’s what the ‘Here’ button does: It will retrieve your current location, set the location picker, and – if an altitude value is available – set the next matching altitude.
I got a field report today from a gas balloon ride that this feature works exactly as advertised.
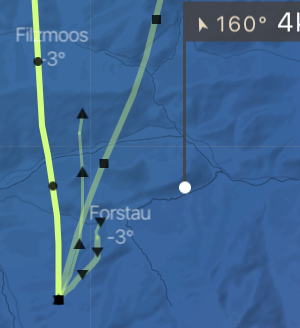
Model-specific markers
Generating tracks for several models and altitudes easily makes for a cluttered screen. So far, all tracks were marked with black circles in (by default hourly) intervals. All trajectories of a given model now have distinguishable black marker icons:
ECMWF – circle
GFS – rectangle
iconEU – triangle, upward pointing
nems, namConus – triangle, downward pointing
Selectively displaying altitudes and forecasts
Selecting several models and altitudes easily makes for a confusing screen. Chris added the capability to selectively turn on/off tracks by model and altitude. To do so, the menu needs to remain open – then, clicking models and altitudes will (de) select the display of the corresponding forecast track (click here for a full-screen version):
Addional forecast models: NEMS and namConus
This version adds two models:
namConus (North American Continental US), 5km grid, by NOAA, some 3 days lookahead)
NEMS by meteoblue.com, 4-12km grid, based on NOAA model with meteoblue extensions added, claims to be strong in Alpine areas, 2 days lookahead, ground up to 1500m (850hPa)
namConus seems generally useful for ballooning purposes and adds a third model for the North American continent in addition to ECWMF and GFS.
NEMS, however, looks rather restricted for aviation purposes as currently available in windy.com – lookahead two days only, and covering altitudes only up to 1500m, which makes it useless except for rather mundane flights. As it stands, this is not a replacement for the meteoblue trajectory function, which covers higher altitudes as well as six days lookahead – for a fee.
Note that NEMS trajectories currently only work with the ‘Layer Interpolation’ option selected – see next section.
Selecting between accuracy and speed
This version adds a switch in the menu: ‘Read data with:’ being ‘Data Loader’ or ‘Layer Interpolation’, with ‘Data Loader’ being the default.
If exploring NEMS trajectories, remember to select ‘Layer Interpolation’ or you will see a message ‘No model’ displayed. Also, remember – NEMS currently only works up to 1500m.
The way I understand this switch – it is a tradeoff between speed and accuracy. Layer interpolation works much quicker (almost an order of magnitude) but sometimes gives odd result.
My recommendation: if exploring many altitudes and models, it might make sense to select Layer interpolation initially, and to switch to Data Loader once you drill down to a smaller set of altitudes and models, yielding more accurate results.
Geekspeak: The Road Ahead (coders only)
Chris tried hard to accelerate trajectory computation, and the Data Loader/Layer Interpolation knob is a step in this direction. But at some point it might make sense to move work to the windy backend.
Right now all the work is done in the browser, but each data point needs a server interaction to retrieve a new value set – which slows things down considerably. That, however, is currently beyond the limitations of the windy plugin model, and would need a way to add user-contributed code to the windy server backend in a safe fashion. I understand things might be moving in this direction.
That said, let me stop the nit-picking: compared to the rest of the crowd, windy.com is a phenomenal step forward by making a weather application user-extensible and hence adapted to specific needs!