My Sagrantino Cup 2020 flights

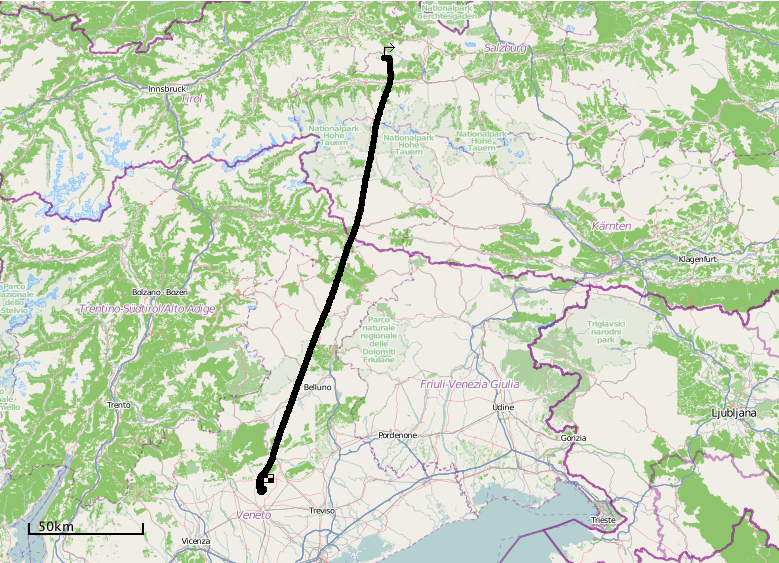
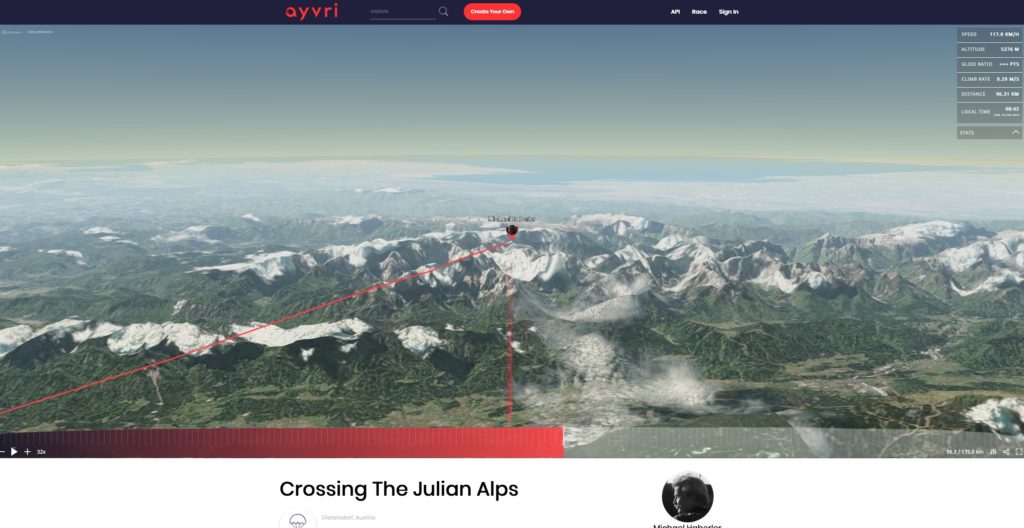
See here for the full-screen version.

How to do it

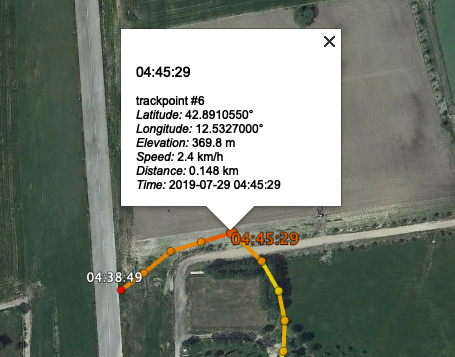
These are GPX files unloaded from my Garmin 695 and processed with gpsvisualizer.com. If you look closely at the end of say, the dark blue track, and click at one of the bullets along the track, you will find this:

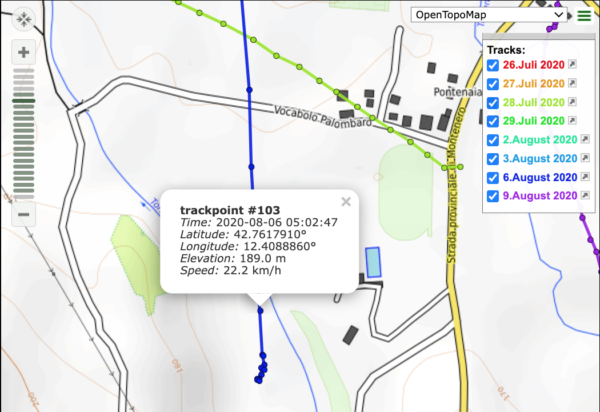
This popup shows a speed value (22km/h just before a rather rough landing). Gpsvisualizer needs this speed value to be in the GPX file before uploading – however, Garmin GPX files do not contain this value. Let’s look at a fragment of a GPX file as unloaded from the Garmin 695:

      <trkpt lat="42.761791000" lon="12.408886000">
        <ele>189.036</ele>
        <time>2020-08-06T05:02:47Z</time>
      </trkpt>

No speed value there – just latitude, longitude, time, elevation. However, one can add speed values to a GPX file with the venerable gpsbabel utility like so (I’m using a shell command here, but you should be able to find a GUI version of gpsbabel for your platform):

 $ gpsbabel -t -i gpx -f input.gpx -x track,speed -o gpx,gpxver=1.0 -F output.gpx

After this step, looking at ‘output.gpx’ we find the speed value (6m/s or 22km/h) was added by looking at time and position of neighbouring points:

      <trkpt lat="42.761791000" lon="12.408886000">
        <ele>189.036</ele>
        <time>2020-08-06T05:02:47Z</time>
        <speed>6.152827</speed>
      </trkpt>

And if you get a track from Ultramagic Flightpack..

you are in for a surprise: great application, and the most brain-dead suboptimal track export format in the industry: a KML file which does NOT have a machine readable starting time, nor do the waypoints have timestamps. There is NO way to automatically convert this track to a GPX file with timestamps – you need an editor and look at the file contents to retrieve the starting time and waypoint interval. Let’s look at this beauty:

<?xml version="1.0" encoding="UTF-8"?><kml xmlns="http://www.opengis.net/kml/2.2">
<Document>
<name>track 15_08_2019 06_33_21.kml</name>
<description>Track created by Ultramagic FlightPack - Starting at time 15_08_2019 06_33_21 - Sampling period is 3 seconds - Flight duration is 1 h 8 min</description>
<Style id="path0Style"><LineStyle><color>7f00ffff</color><width>20</width></LineStyle></Style>
<Placemark><name>track 15_08_2019 06_33_21.kml</name>
<styleUrl>#path0Style</styleUrl>
<LineString><altitudeMode>absolute</altitudeMode><coordinates>
15.632430883139,48.4467375744585,314.975244567425 
15.632430883139,48.4467375744585,314.918412871592 

So the fact that this track starts at Aug 15, 2019 05:33:21 and each point is sampled 3 seconds apart is hidden in a comment – meaning all KML-processing programs will ignore it.

Again, gpsbabel helps into making this mess usable again – it can add ‘fake timestamps’ as starting time and equally spaced for each waypoint – so after getting the clue from above we can do this:

$ gpsbabel -i kml -f 'track_15_08_2019 06_33_21.kml' -x track,faketime=f20190815063321+3 -o gpx -F output.gpx
$ gpsbabel -i gpx -f output.gpx  -x track,speed -o gpx,gpxver=1.0 -F final.gpx

Gpsbabel needs two steps to fix this up. Thereafter, final.gpx looks usable:

      <trkpt lat="48.450746052" lon="15.634726184">
        <ele>517.158</ele>
        <time>2019-08-15T06:42:51Z</time>
        <speed>2.132435</speed>
      </trkpt>

I’ve reported this to Ultramagic last August, asking them to fix it. I got an unpleasant reply. Other than that, Flightpack is still producing nonsense. Thanks, guys!

Next step: visit gpsvisualizer and add all processed GPX files in the list of uploads. Also, set the parameters according to this image:

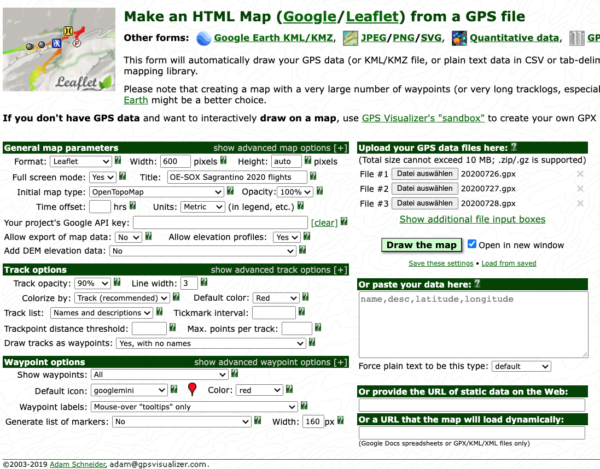
Click on ‘Draw the map’, and download the resulting HTML file. That is what you are seeing above.

Animating a GPS track

So you had a great flight. You unload your GPS and now have a GPX file. How do you share the experience with others?

Well, draw it on a map like so:

Boring display of a great flight

Pretty bland, if you ask me – “yes, we’ve been here and there too”. in Flatlandia, that is. The dynamics of the flight experience, great views – gone.

You could generate a KML file and tell folks to view it in Google Earth. Works, if they have Earth installed – which translates into “almost nobody”. With an advanced degree in Earth, you can even create an animation video. But that takes time and lots of moving files around.

What I’m looking for is – send out a link, and everybody with a browser at hand could re-live the flight, drag, pan, and zoom around like so:

and.. also be able to embed this on a web page.

Do-it-yourself like so:

  • create a free account on Rikitraki.com
  • upload your GPX file
  • click the “3D” icon and the Play button

That’s it!

Another option: ayvri.com

Turns out there are several sites which provide similar services. Ayvri.com also sports free accounts, with the option to upload GPX files. Other than rikitraki.com ayvri optionally displays current flight data (speed, altitude, climb/sink rate, distance, time) – very nice!

Click the image below to run the actual animation on ayvri.com:

Flight animation with ayvri.com.

Pretty much the same drill as above:

  • create a free account on https://ayvri.com
  • upload a GPX file and describe the flight
  • click “Create Scene”
  • click the “Stats” dropdown (right top) for flight data
  • view the animation
  • record its URL for sharing.

While rikitraki seems to be more of a single-programmer hobby project, ayvri looks more professional and polished, with a company, free/paid options, an API and a Twitter & Facebook presence behind it.

Creating tracks for Google Earth from GPX files

Google Earth is a great viewer for flight tracks. While GPX files can be imported into GE, they do not look appealing – and lack useful information.

Enter gpsvisualizer.com: a free online service to convert GPX files to the GE KML format (among many other features). I mostly use the Convert your GPS data for use in Google Earth service to visualize flights with these settings:

  • Google Earth doc name: start, destination & day of flight
  • Colorize by: Speed
  • Altitude mode: Absolute (for flights)
  • Draw a shadow: 30% opacity – yields an actual track over ground

Tip: click Save these settings and next time all settings will be restored.

Gpsvisualizer.com parameter settings

The result is a compressed KML file which looks like so when openend in Earth:

Update:

Many GPS sources create lots of trackpoints – so much that the resulting tracks look like a series of balls. Way too dense to be useful.

Also, the line segments generated by the settings above lack useful information (just text like ‘trkpt 660’). Adding waypoints in gpsvisualizer adds more detail.

Hour marks, as well as time stamps for takeoff and landing time are lacking above.

A good setting to deal with these issues is:

  • “Trackpoint distance threshold” : 20m
  • “Draw as waypoints”: Yes, named with timestamps
  • “Tickmark interval”: 1h
  • “Zero distance mark”: Yes (this field only appears when you enter a value into “Tickmark interval”)

This gives us waypoints every 20m (good enough) and klicking them in GE reveals useful information:

Clicking a waypoint. Note timestamp on takeoff location

The updated result file can be downloaded here.