Windy trajectory functions improved

Chris, the author of the traj plugin, has released a new version (0.5.1) with new functions – it is easier to use and more powerful! Also, a few days ago, windy updated the web version of their product and made it much simpler to work with plugins. So let’s have a look:

When you now click on the “Hamburger menu” (three horizontal bars, left top) and then “Install Windy plugin”, you see a gallery of approved plugins with an example screenshot, description with a link to more detail – scroll down to “Trajectory”, click “Open” and you are done!

Starting plugins in windy has become much easier

The traj plugin is now structured into a large parameter pane on the left, and a small operations menu center bottom – first, set all your params in the left pane, then run the operation from the operations menu.

Any parameters you set will be recorded and come up as before when you run windy.com again.

Example: parameters for a typical 2-hour summer season balloon ride

  • “Select levels” – select all from 100m to 1500m
  • “Select models” – ecmwf, gfs, iconEu (all are done in one go now – no more clicking “Start”, wait, change forecaste model, iterate!)
  • “Settings” – ascent/descent: 0 m/s, duration 2:00, everything else default
  • “Airspaces” – optional. Expand the menu; in my case, I click “Austria”; in case your screen gets overly cluttered, you can remove that airspace by clicking the small white-cross-on-red button besides the country name.

Thereafter, you do not need the parameter pane any more- click it away with the white-cross-on-red button on the top to get more screen space.

Next, select a start time by shifting the time selector at the bottom to your desired start time.

Finally, select a location. I use favourites – click on the heart icon in the operations menu, and select a location. Click the heart icon again to close the location dropdown. This will set the “location picker” – if there’s a message on screen saying “Place Picker”, repeat that process – it’s very easy to accidentally deselect the location picker.

Good to go! Click “Start” in the operations menu. That button changes to “Stop” while the process is running, and changes back to “Start” when done – wait for it. You will wind up with a screen roughly looking like so:

Trajectory generation finished

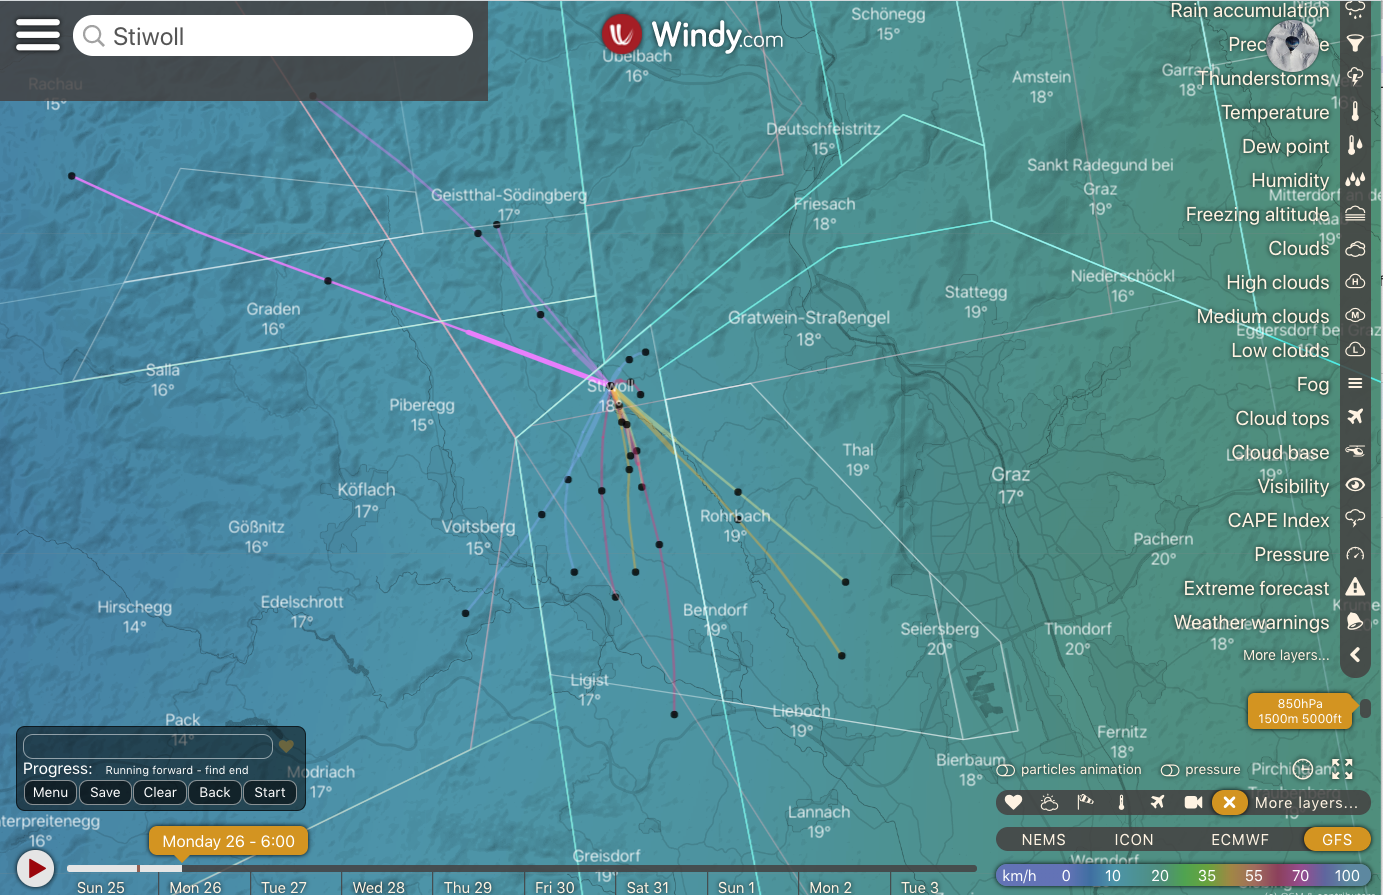
The black bullets along a track correspond to the “Marker intervals” setting in the parameter pane – I leave those as default, 1 hour.

Interpreting the results

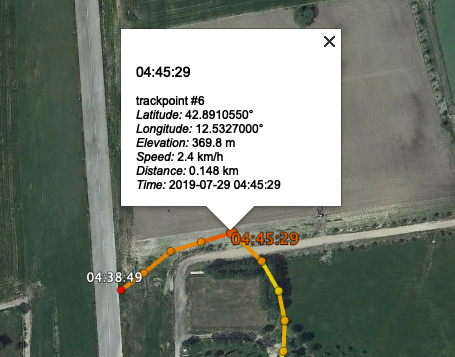
Click on a track – a two-part panel will pop up telling you more detail about this particular track at this point:

Forecast detail when clicking on a track

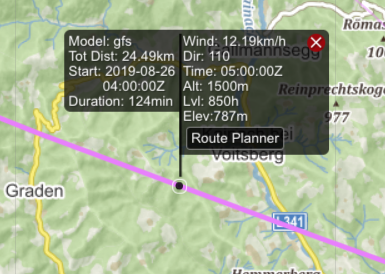
The left panel states the forecast model, and the time when the model was last updated.

The right panel shows wind speed, wind direction, time, altitude and ground elevation – so at the point we’d be roughly 700m above ground.

Note the “Route Planner” button – we’ll cover that in the next section (this function only works with tracks generated by the ECMWF model).

Usually tracks vary substantially at low levels, whereas in the free atmosphere tracks tend to converge quite closely. That degree of divergence between models for a given altitude also gives you a hint as to the likelihood of an actual flight matching the forecast. Several models agree: likely that is where you’re actually going.

I tend to believe the ECMWF forecasts most, with ICONEU a close second. But that is gut feeling and not science.

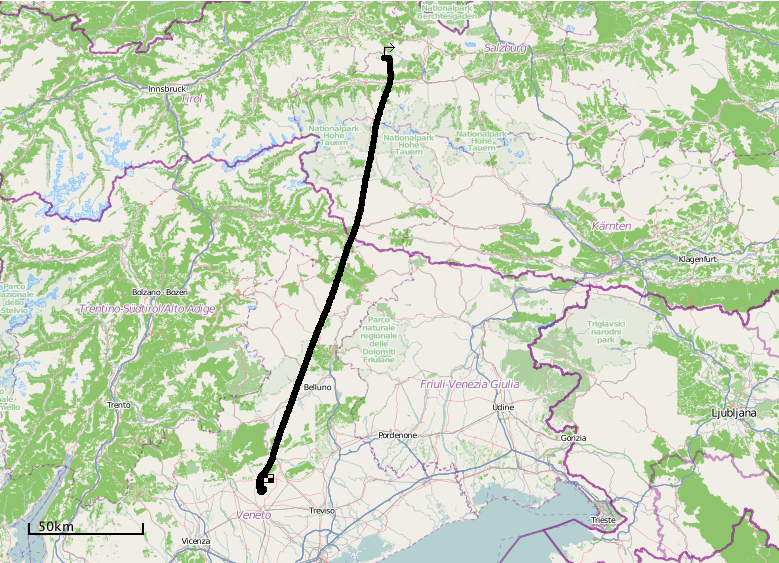
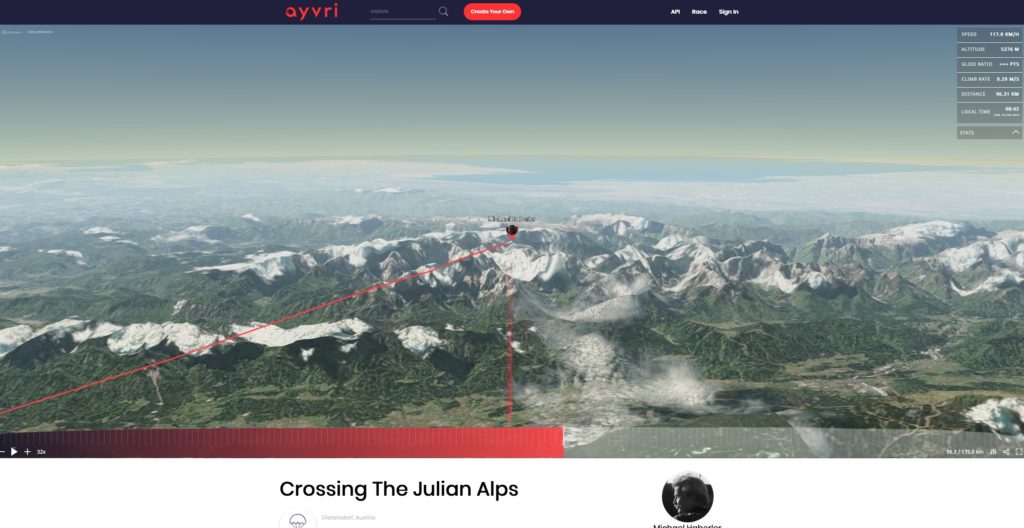
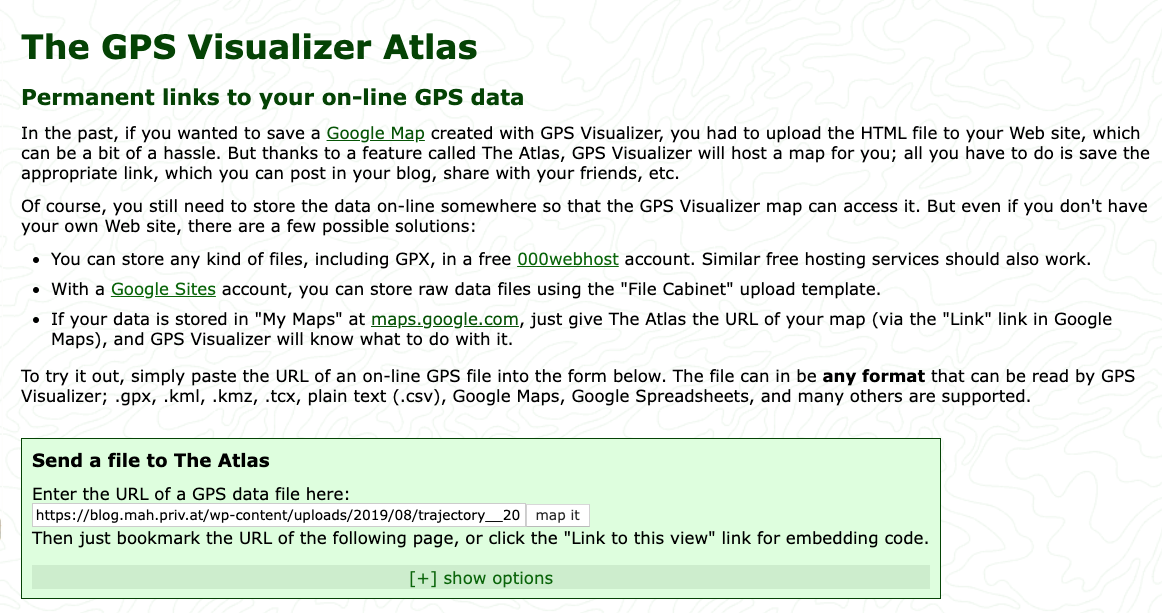
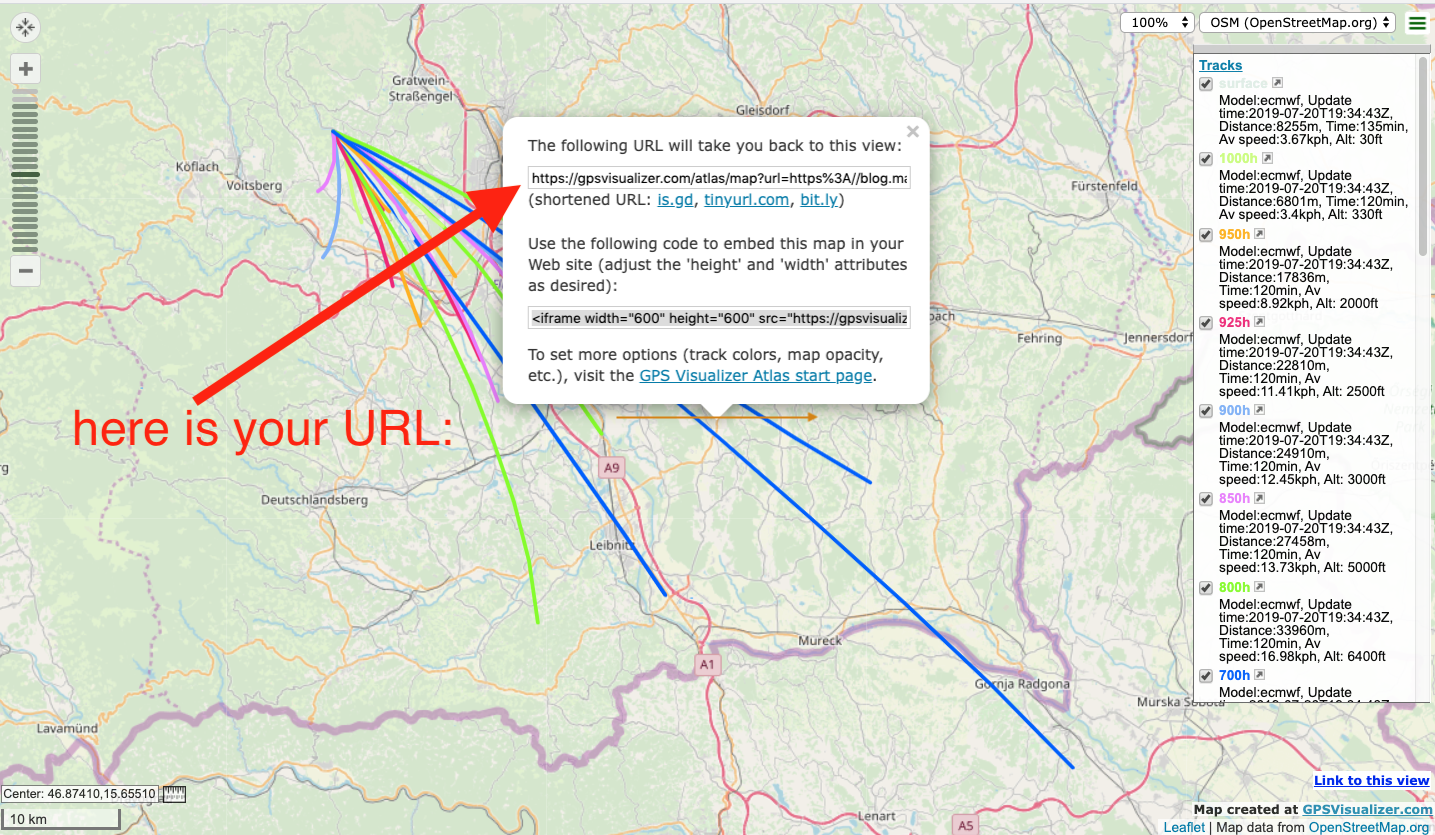
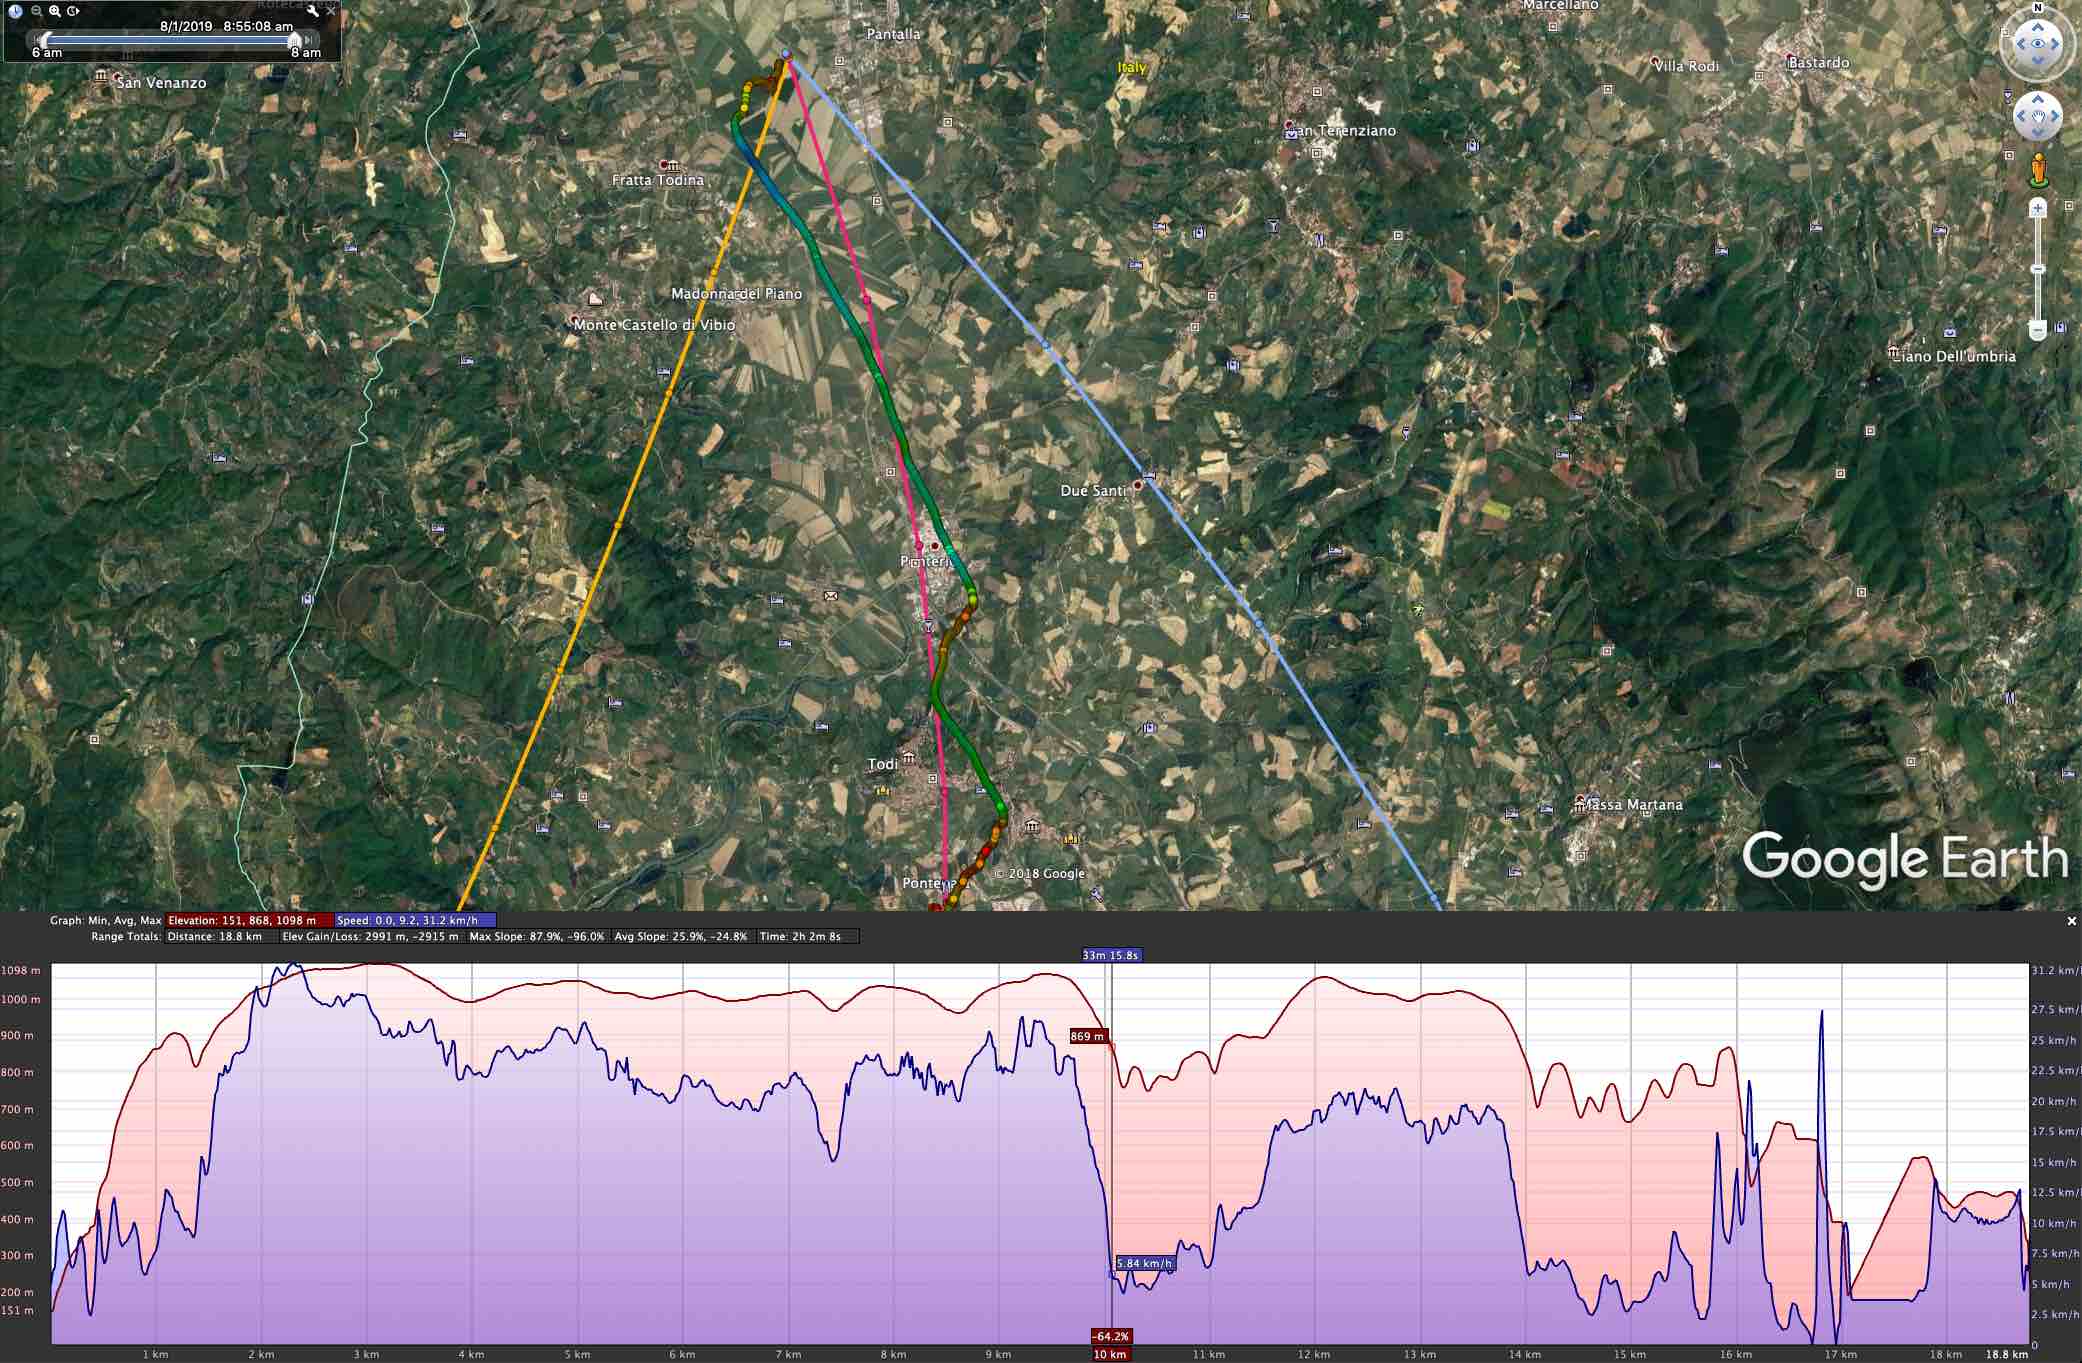
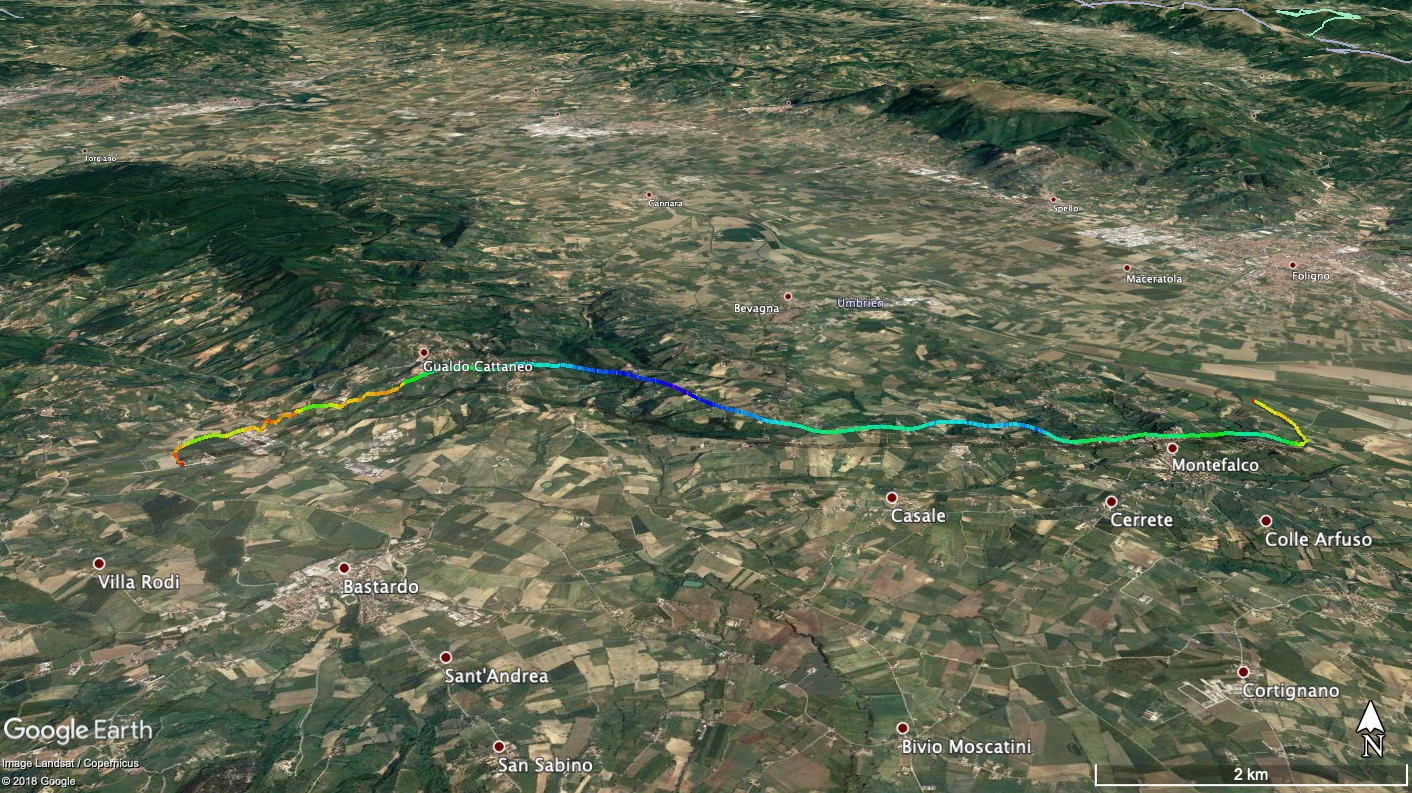
If you want to save those forecasts, click “Save” in the operations menu. The resulting file will be in GPX format and can be published for other people to see like so.

Drilling down: displaying a cross section

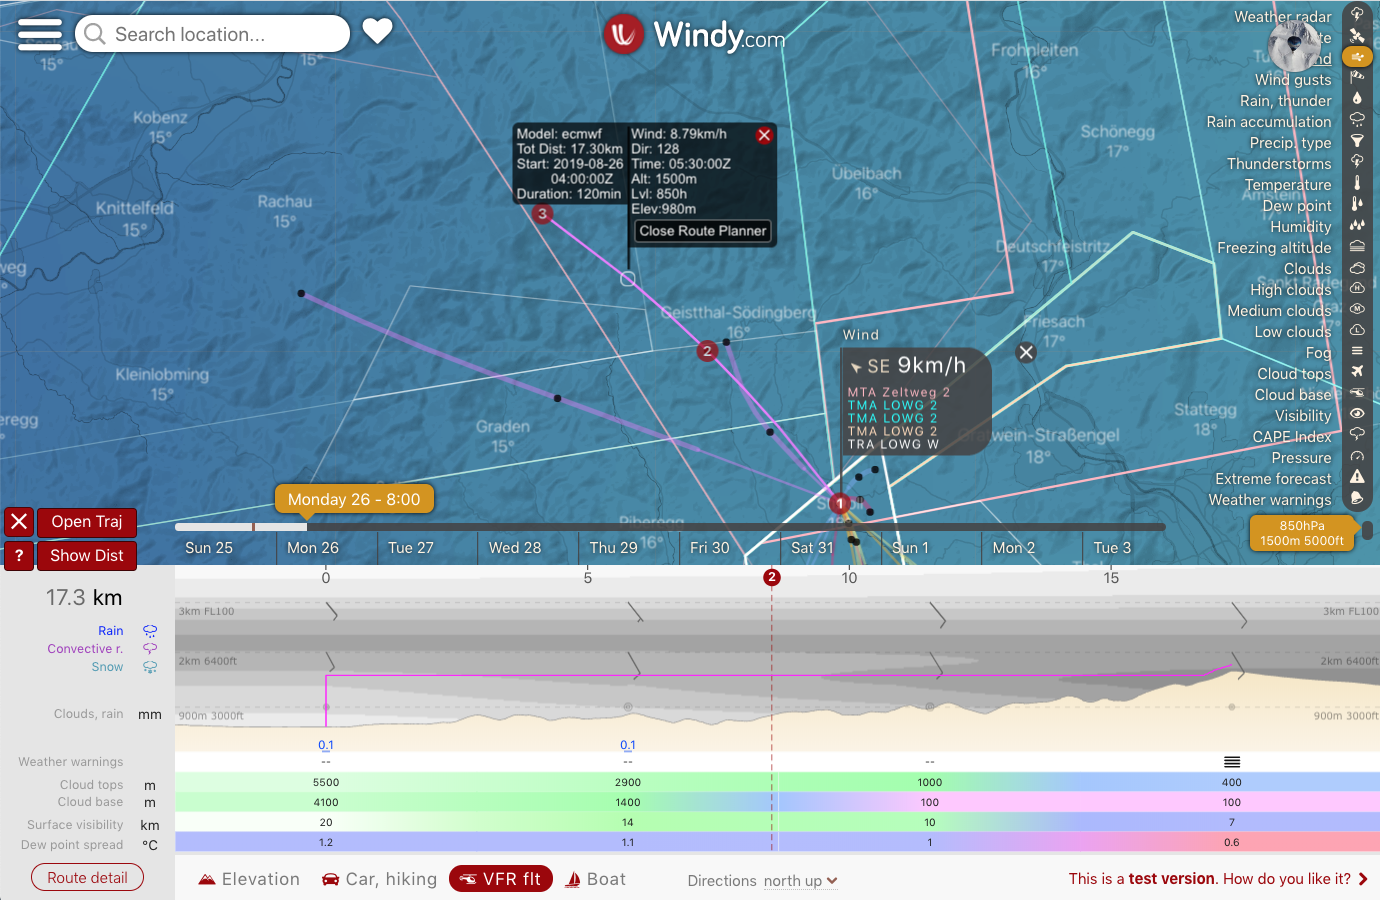
Click on an ECMWF forecast track, then click on the “Route Planner” button. This will split the screen vertically and the atmosphere cross section along this track comes up in the bottom half:

Atmosphere cross section along forecast track

This is really handy for a quick look on conditions en route. Look here for more information on the Route planner. This only works with ECMWF-generated tracks – not for GFS or ICONEU.

Update: Route Planner just was improved (Airgram and IFR view added) and that update also shows if Route Planner is activated via the traj.

Big Fat Warning: See the “Directions north up” dropdown near the bottom of the last screenshot? There are two more options which are seriously confusing with respect to wind barbs: “from left to right” and “from bottom to top”.

You want to set this dropdown to “north up” or the wind barbs will be relative to your course(!!). That possibly makes sense for airplanes but not for balloon rides.

For an explanation, see the section “How to choose your direction on the map”.

I wrote a note on Route Planner.

Animating a GPS track

So you had a great flight. You unload your GPS and now have a GPX file. How do you share the experience with others?

Well, draw it on a map like so:

Boring display of a great flight

Pretty bland, if you ask me – “yes, we’ve been here and there too”. in Flatlandia, that is. The dynamics of the flight experience, great views – gone.

You could generate a KML file and tell folks to view it in Google Earth. Works, if they have Earth installed – which translates into “almost nobody”. With an advanced degree in Earth, you can even create an animation video. But that takes time and lots of moving files around.

What I’m looking for is – send out a link, and everybody with a browser at hand could re-live the flight, drag, pan, and zoom around like so:

and.. also be able to embed this on a web page.

Do-it-yourself like so:

  • create a free account on Rikitraki.com
  • upload your GPX file
  • click the “3D” icon and the Play button

That’s it!

Another option: ayvri.com

Turns out there are several sites which provide similar services. Ayvri.com also sports free accounts, with the option to upload GPX files. Other than rikitraki.com ayvri optionally displays current flight data (speed, altitude, climb/sink rate, distance, time) – very nice!

Click the image below to run the actual animation on ayvri.com:

Flight animation with ayvri.com.

Pretty much the same drill as above:

  • create a free account on https://ayvri.com
  • upload a GPX file and describe the flight
  • click “Create Scene”
  • click the “Stats” dropdown (right top) for flight data
  • view the animation
  • record its URL for sharing.

While rikitraki seems to be more of a single-programmer hobby project, ayvri looks more professional and polished, with a company, free/paid options, an API and a Twitter & Facebook presence behind it.

Custom cross-sections with windy

The windy team recently released Route Planner, a tool to generate cross-sections over one or several legs of a flight. It’s seriously useful!

Give it a try with a desktop browser (support on mobile is still limited):

  • Set time and the ECMWF model, and zoom the map so all legs of the planned flight will fit
  • right-click on the start point and select “Distance and planning” in the dropdown
  • click one or several waypoints of your flight
  • at the bottom, select “Load route forecast for”: “VFR flt”
  • make sure the dropdown near the bottom shows “Directions north up”. See here why.
VFR Route forecast for Walchsee-Udine, Friday Aug 16, 8:00 loc

Displaying trajectories for the masses

How would you distribute windy trajectories during weather briefings at balloon events? You did save the result as GPX file. And now what?

Paper: meh. Display screenshot on projector? confusing spaghetti. Post a KML or GPX file on a whatsapp group? hardly anybody could open such files on their mobiles and pads.

Pretty easy with GPSVisualizer:

  • upload the GPX file so it is Internet-accessible and note its URL (e.g. as a WordPress media file – here’s an example GPX file for you to play with)
  • goto GPSVisualizer.com and paste the URL of the GPX file into the “Send a file to The Atlas” field:
GPSVisualizer Atlas page
  • hit the “map it” button – you should see something like this:

That’s thew view you’d want to distribute – people can pan and zoom around, and select/deselect heights and models in the trajectory set.

To create a URL for this view:

  • Click the blue “Link to this view” field at the right bottom:
Generating a public URL with GPSVisualizer Atlas

And here is the URL which you can post online – displaying the above map.

Edit: There is currently a minor bug in the GPSvisualizer web service – uploaded tracks vanish after a certain time, and the message ‘File … contains no usable data’ is displayed.

To work around this issue, add ?cache=0 to the Atlas link like so.

Trajectory forecast vs track flown: a case study

During the recent Sagrantino Cup event I created daily trajectory forecasts with the windy.com traj plugin for the morning flights and asked pilots to share actual GPS tracks so I could compare actual versus forecast. Here is one example:

ECMWF forecast versus actual track – click to enlarge

The KML file for this screenshot is available here, and it is instructive to play with it – have a look at it yourself in Google Earth.

  • Most of the flight was between 800m and 1000m altitude, so I selected the 2000ft (amber), 2500ft (red) and 3000ft (blue) trajectories.
  • The ECMWF model had the best match, so only ECMWF forecasts are shown.
  • The flight started on the valley floor, within an inversion and a slight northerly flow.
  • The match is excellent – especially with the 2500ft trajectory, and the descent phases around 11km and 15km into the flight show the northeasterly flow forecast by the amber line.
  • As to be expected, the track is shorter than the forecast – slightly more than half the distance.
  • my gut feeling after comparing several forecasts to tracks: ECMWF wind speed forecasts are a tad on the high side.

Here is a second example:

  • trajectory colors: red: 2500ft, blue: 3000ft, purple: 5000ft
  • most of the flight was 1000-1200m altitude
  • the track’s match with the 3000ft trajectories (all models) again is very good!

Creating wind trajectories with windy.com

Update: head over here for the current version of the trajectory function – the text below documents plugin versions below 0.5.1.

windy.com is a phenomenal resource for weather forecasting. It’s less of a “will it rain at X by Y” type app but rather a data viewer for many different layers of information – you will have to draw your own conclusions. It also sports a variety of forecast models (among them the $$$ ECMWF) – for free. And it supports user-written plugins for specific purposes, which has unleashed a lot of creativity by weather-affine geeks.

For balloonists, the traj plugin is very useful – it can create tracks to answer the question “If I start at X and fly level in altitude Y at time Z, which track would I fly?”. And it can answer this according to several weather models – in Europe that’d be ECMWF, GFS and ICON-EU.

Here’s a short how-to for generating trajectories:

  • The traj plugin currently only works on desktop browsers – not (yet) on mobiles
  • The plugin must be explicitly loaded after pointing your browser to https://www.windy.com/ : click on the top left “Hamburger” (three horizontal bars) icon. In the dropdown, click “Install Windy plugin” and scroll down until you find the “Trajectory” plugin – then click on “Open”.
  • two windows will appear – one with explanations and one for parameters.
  • Select altitudes and duration in the parameter window.
  • Set a start time using the time selector at the bottom of the screen.
  • Select a model (ICON, ECMWF or GFS) in the right bottom model selector.
  • Choose a start location – either by clicking on the map window (the “picker”) or choosing a favorite by clicking the heart icon in the parameter window which will present a dropdown of your favorite locations
  • click “Start” – which changes the label on this button to “Stop”
  • the progress can be seen on-screen as the curves are drawn
  • the black bullets denote hourly intervals
  • Click on the lines, or the bullets for detail information (time, speed, model, model generation time etc)
  • when the plugin is done, you can download the trajectories as GPX files by clicking “Save”
Trajectory tutorial video (slightly out of date)

Advanced features include:

  • simulation of ascent and descent – if set to zero, just level flight will be simulated
  • backwards trajectories – those answer the question “If I want to go to location X, where do I need to start?”
  • duration of the trajectory: up to 240 hours – useful for gas balloon flights

For a discussion of the features and for reporting errors, see the Windy community website topic on the traj plugin.

For the curious: an example GPX file generated by the traj plugin

For geeks: here is the plugin code.

Creating tracks for Google Earth from GPX files

Google Earth is a great viewer for flight tracks. While GPX files can be imported into GE, they do not look appealing – and lack useful information.

Enter gpsvisualizer.com: a free online service to convert GPX files to the GE KML format (among many other features). I mostly use the Convert your GPS data for use in Google Earth service to visualize flights with these settings:

  • Google Earth doc name: start, destination & day of flight
  • Colorize by: Speed
  • Altitude mode: Absolute (for flights)
  • Draw a shadow: 30% opacity – yields an actual track over ground

Tip: click Save these settings and next time all settings will be restored.

Gpsvisualizer.com parameter settings

The result is a compressed KML file which looks like so when openend in Earth:

Update:

Many GPS sources create lots of trackpoints – so much that the resulting tracks look like a series of balls. Way too dense to be useful.

Also, the line segments generated by the settings above lack useful information (just text like ‘trkpt 660’). Adding waypoints in gpsvisualizer adds more detail.

Hour marks, as well as time stamps for takeoff and landing time are lacking above.

A good setting to deal with these issues is:

  • “Trackpoint distance threshold” : 20m
  • “Draw as waypoints”: Yes, named with timestamps
  • “Tickmark interval”: 1h
  • “Zero distance mark”: Yes (this field only appears when you enter a value into “Tickmark interval”)

This gives us waypoints every 20m (good enough) and klicking them in GE reveals useful information:

Clicking a waypoint. Note timestamp on takeoff location

The updated result file can be downloaded here.