The TT34 is an envelope temperature sensor for hot air balloons, and has been around for at least 15 years, so many people own one. It was intended to be used together with the (now discontinued) Flytec 3040 Vario:
The Flytec TT34 temperature transponder
I got curious if one could receive the sensor values from the TT34 with other hardware, maybe a small microcontroller with a suitable receiver for the 433Mhz band (or 418Mhz for USA). So I had a look at the transmission and protocol messages sent by the TT34. For a start, I disassembled the TT34 and the Flytec 3040 and had a look at the electronics.
A particular TT34 and an 3040 are “paired” with a serial number, so any 3040 will receive data only from it’s paired counterpart. The serial is printed on the case, in my case it is a 4-digit number (5850 or 0x16DA hex).
Electronics
The TT34 has an AM-RT4 transmitter module and the Flytec 3040 has a Philips UAA3201T receiver. Both are for AM (amplitude modulation) – the RT-4’s “data input” pin is really a “transmitter on/off” pin. So the transmission method is really a glorified morse code – the receiver manual describes it as “AM Return-to-Zero (RZ) Amplitude Shift Keying (ASK) modulation”. So – step1: record the signal:
Transmission signal
I recorded the transmission with an old scanner radio to a wav file – it looks like so in Audacity:
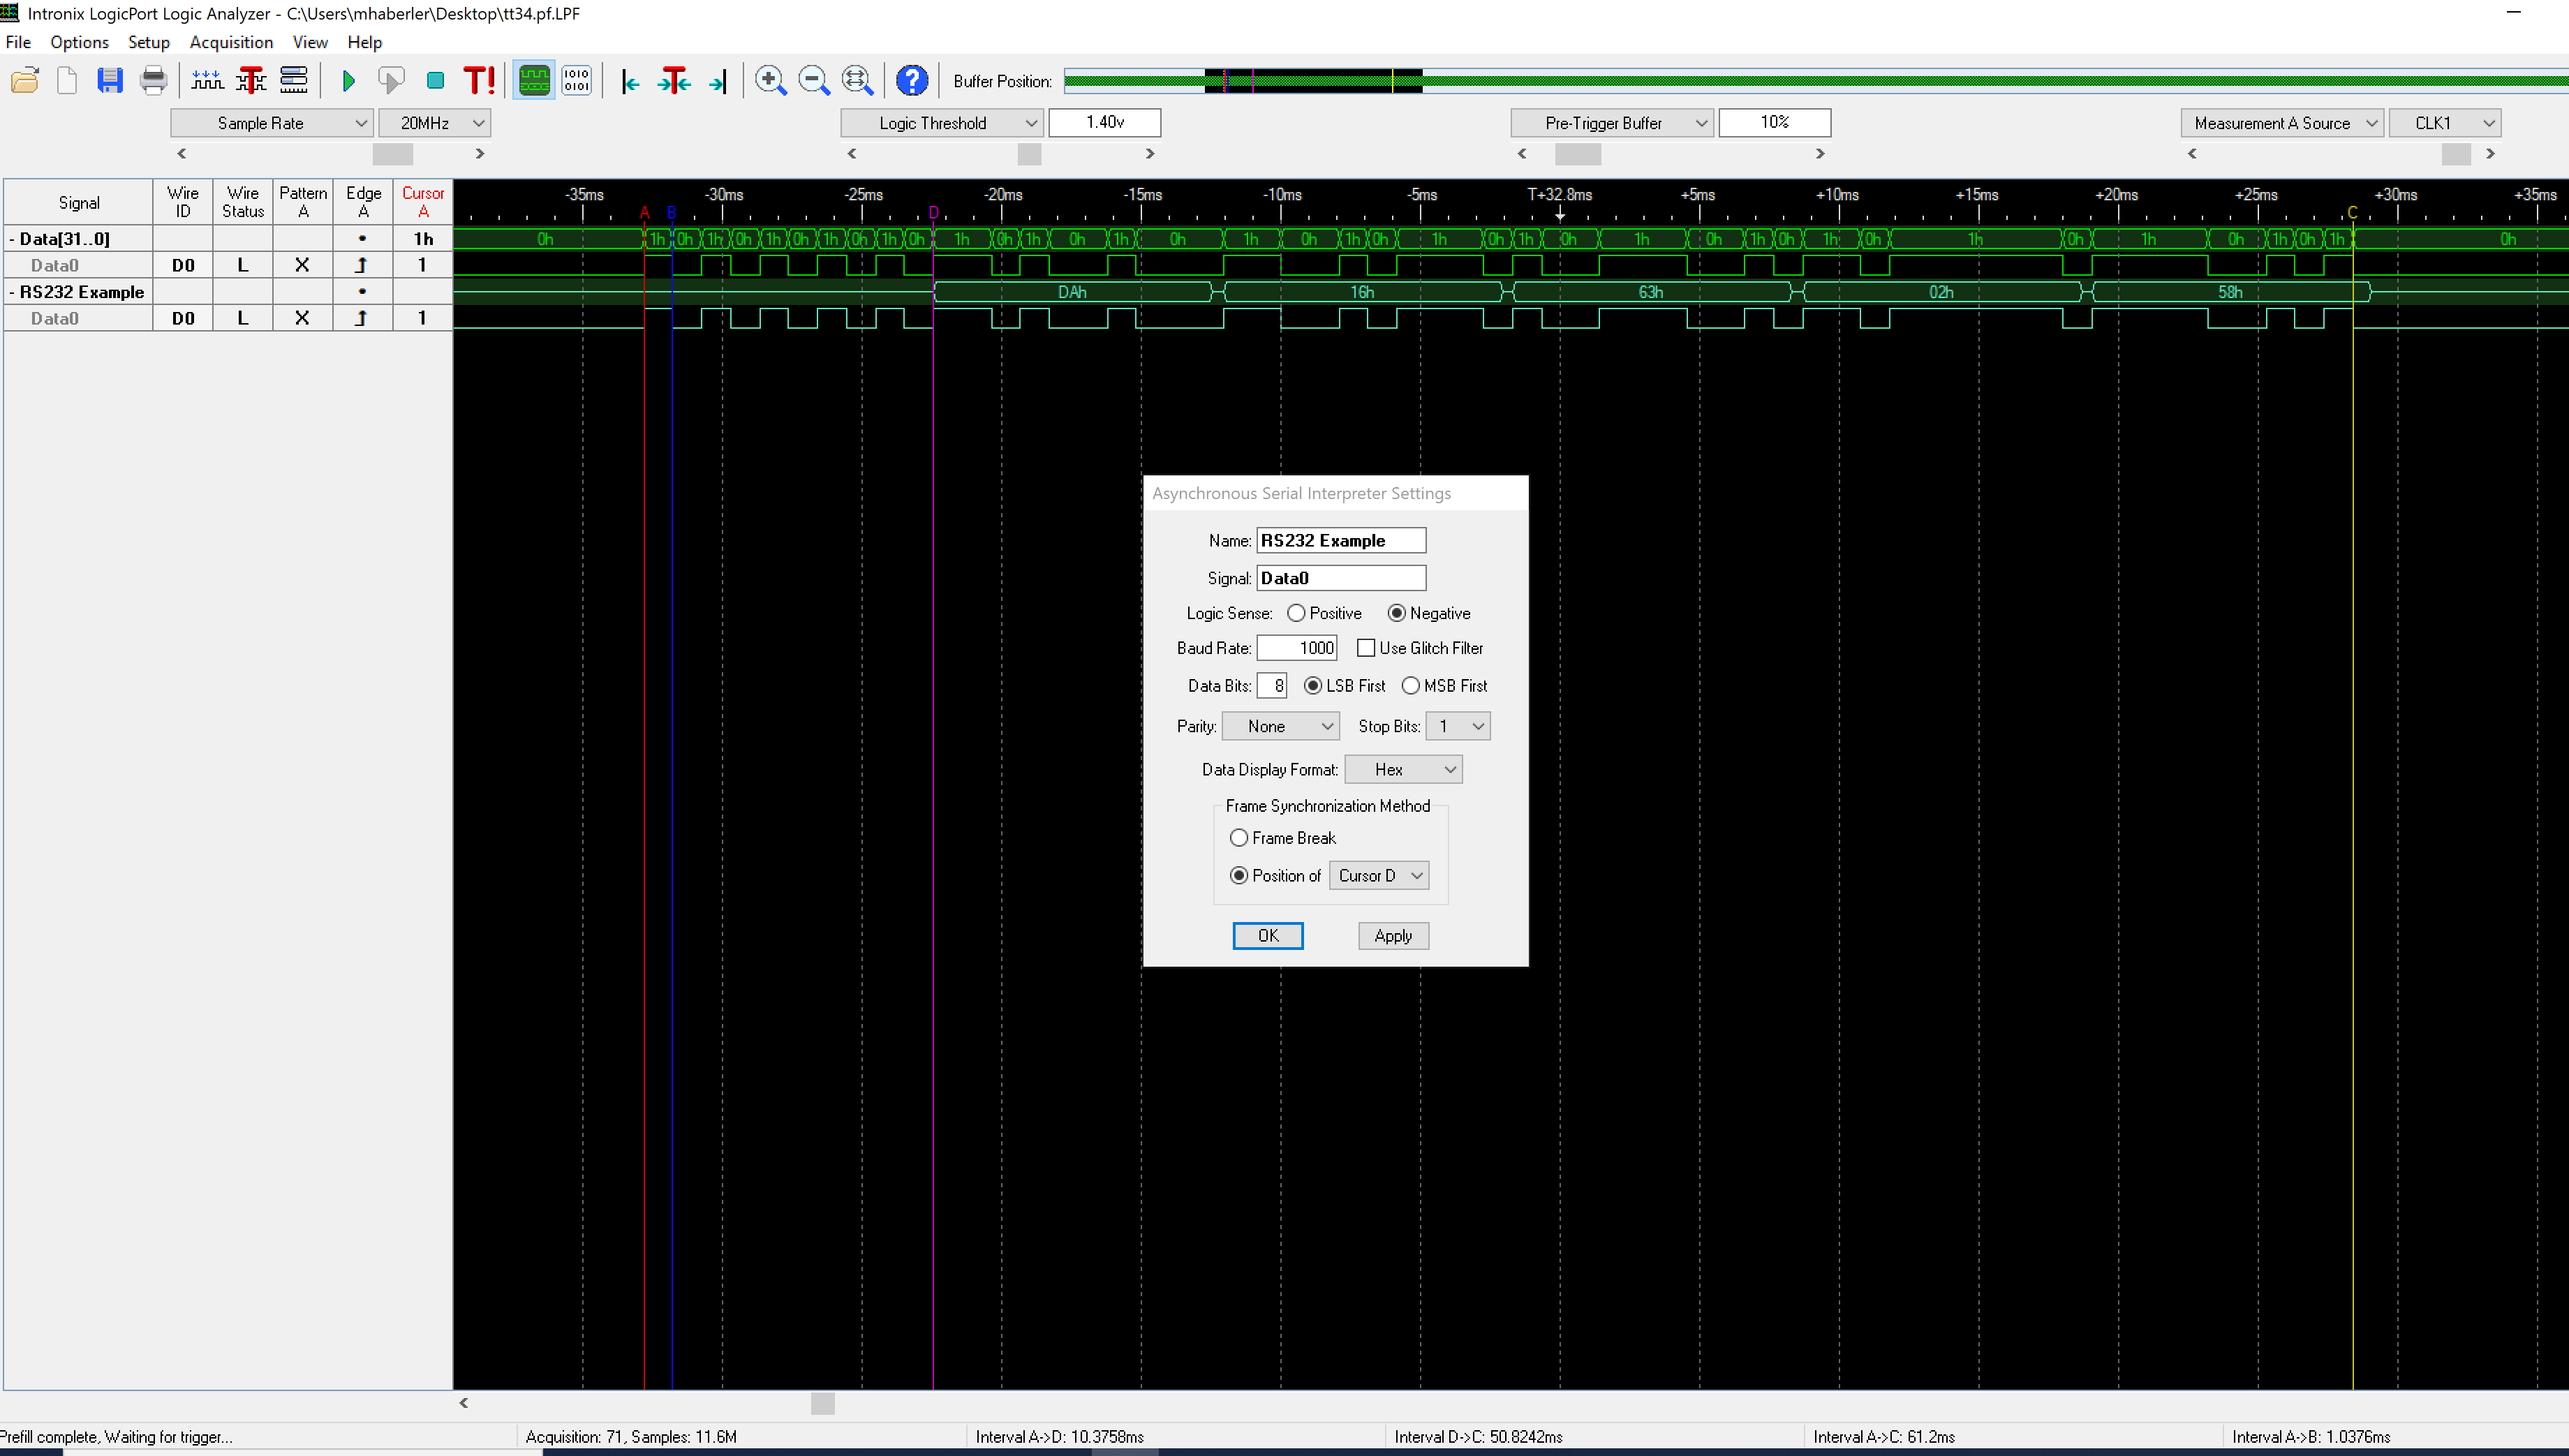
There’s clearly a bit pattern maybe 5 or 6 bytes long, but decoding that looks challenging. So I opened the TT34 and connected a logic analyzer to the data pin of the transmitter chip – much clearer picture:
TT34 transmit signal before RF module
Timing and packet structure
With a bit of staring at the display and playing with decoding parameters it became clear:
The duration of the bit pattern is 1mS.
The overall transmission length is about 60 bits or so.
The signal can be decoded as an asynchronous bit stream, 8bits, 1 stop bit, no parity (so total 10 bits/character) which makes the message 6 bytes long – this fits with the 60 or so bits mentioned above.
The RS232 decoder of my LogicPort Analyzer can decode the message fine when setting the bitrate to 1000bps (not 1200bps!), so it looks like an async transmission with a non-standard bitrate.
There is a fixed pattern at the beginning (0x55) and varying bytes thereafter.
The first two bytes correspond to my serial number (0x16DA)
The two following bytes are the temperature encoded as two decimal numbers – the value in the picture (63h 02h) is displayed as 26.3° on the Flytec 3040.
there is a trailing byte of varying content. I assumed it might be a checksum to guard against transmission errors, but it is not – none of the 8bit checksum algorithm in the Python crccheck package revealed any clues.
After studying the manual I noticed that the TT34 can report a broken sensor, and that fact is displayed by a special symbol in the temperature display field. I disconnected and reconnected the sensor and observed how the trace changes: it turns out that a broken sensor toggles bit 0x04 in the last byte of the transmission – if it is set, this indicates a broken sensor. The other fields have a known purpose, so the last byte is some flag field.
I was unable to guess the meaning of the remaining bits in the last byte – they do change between transmissions.
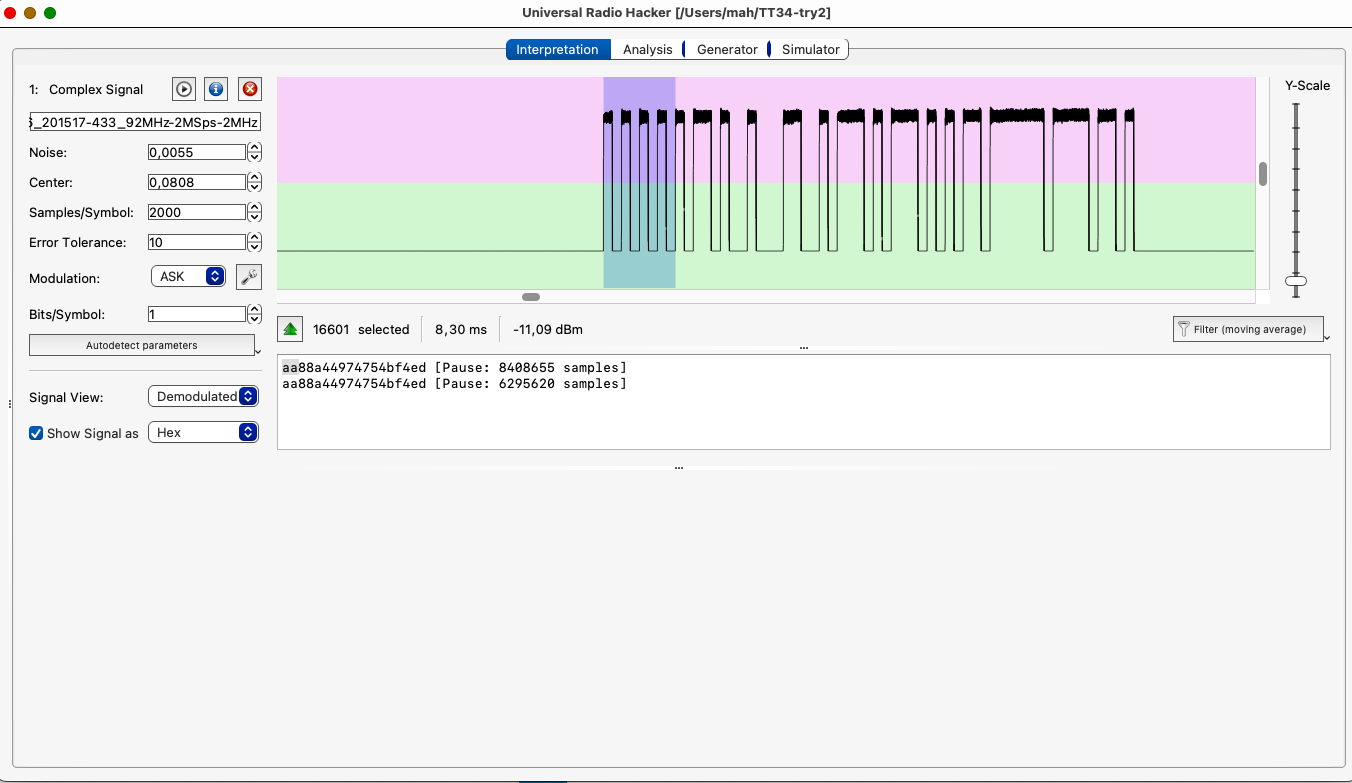
I recently found an interesting tool to reverse-engineer digital radio transmissions: Universal Radio Hacker (urh) and decided to give the RF side a spin with my HackRF software-defined radio while exploring urh.
Investigate the radio spectrum
The Spectrum analyzer view makes it easy to detect the radio transmissions:
Record the transmission
we record at 2M samples/second and capture two transmissions:
When done, close the record signal window and we’re off to interpretation:
Interpretation view
urh has a phenomenal autodetection code – it recognizes bit timing really well and tries to decode the bit stream.
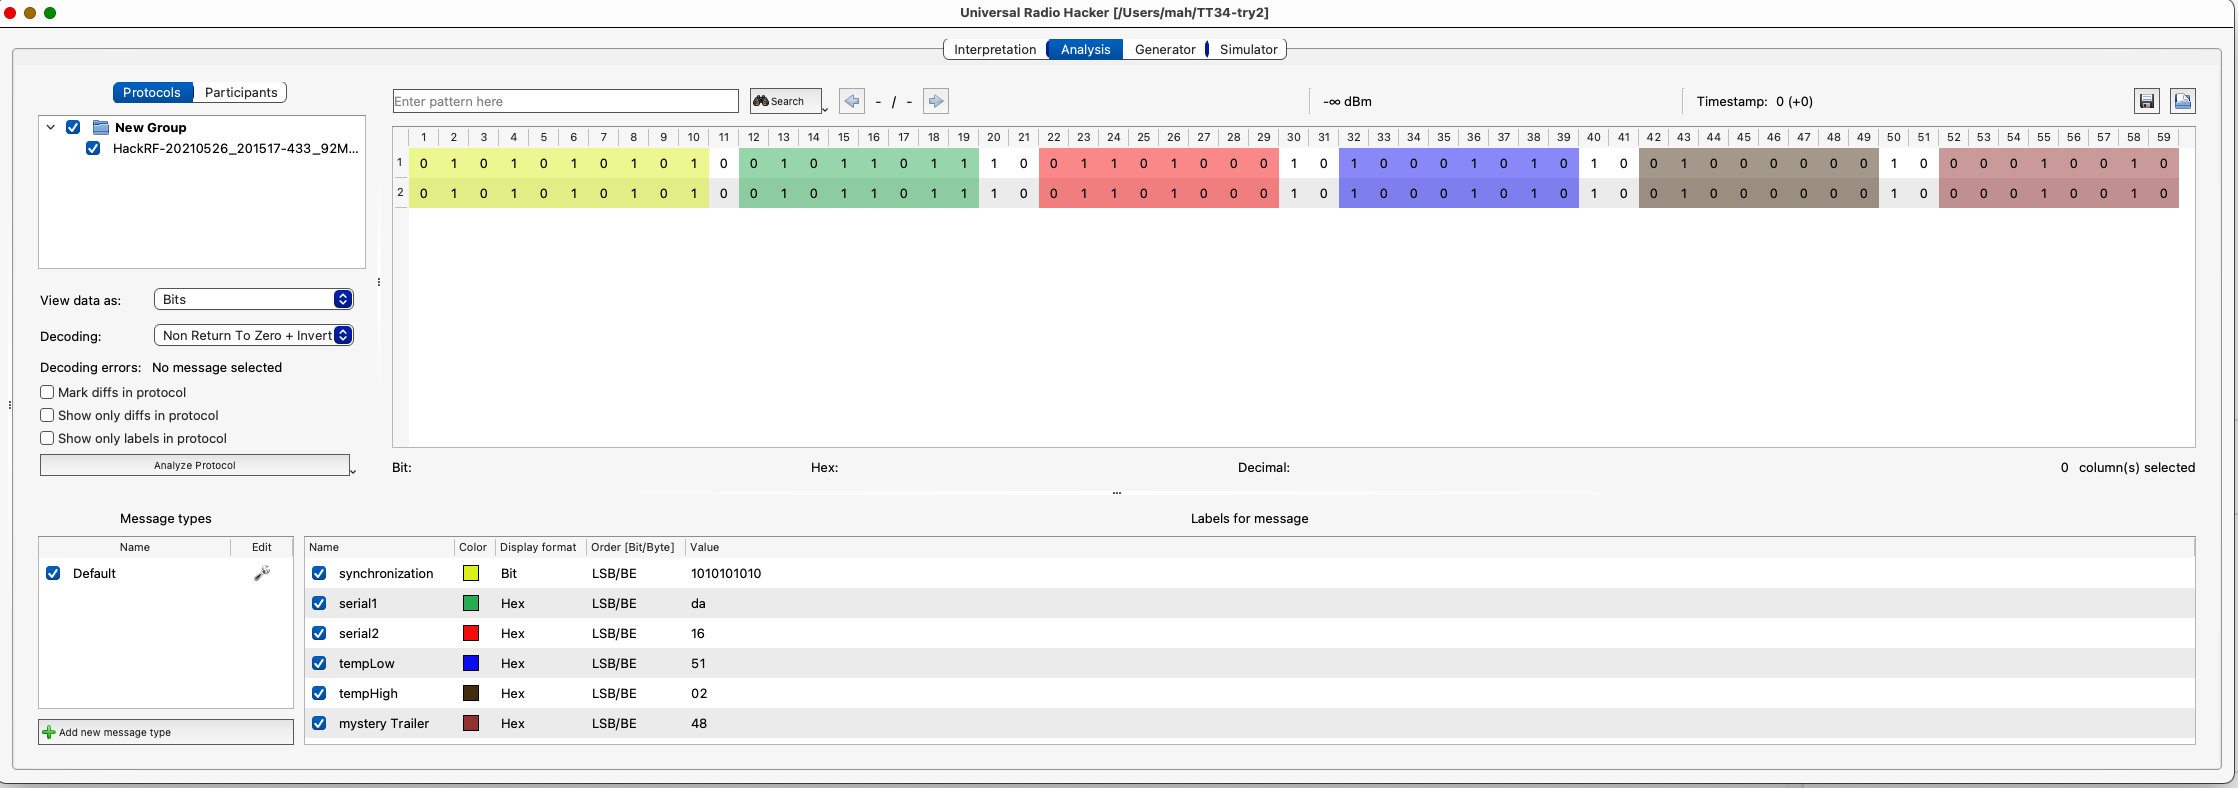
Analysis view
The analysis enables us to annotate the bits and their meanings. Luckily the results are identical to the logic analyzer view!
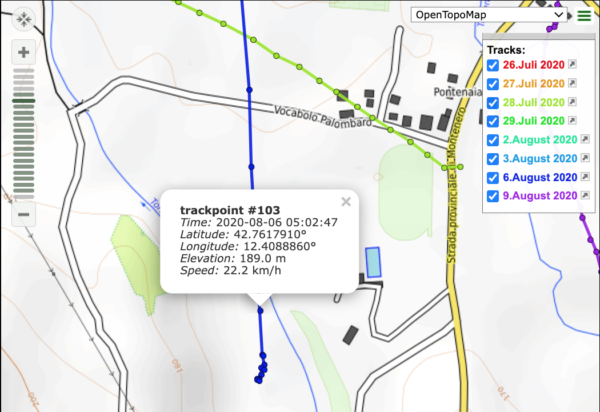
These are GPX files unloaded from my Garmin 695 and processed with gpsvisualizer.com. If you look closely at the end of say, the dark blue track, and click at one of the bullets along the track, you will find this:
This popup shows a speed value (22km/h just before a rather rough landing). Gpsvisualizer needs this speed value to be in the GPX file before uploading – however, Garmin GPX files do not contain this value. Let’s look at a fragment of a GPX file as unloaded from the Garmin 695:
No speed value there – just latitude, longitude, time, elevation. However, one can add speed values to a GPX file with the venerable gpsbabel utility like so (I’m using a shell command here, but you should be able to find a GUI version of gpsbabel for your platform):
And if you get a track from Ultramagic Flightpack..
you are in for a surprise: great application, and the most brain-dead suboptimal track export format in the industry: a KML file which does NOT have a machine readable starting time, nor do the waypoints have timestamps. There is NO way to automatically convert this track to a GPX file with timestamps – you need an editor and look at the file contents to retrieve the starting time and waypoint interval. Let’s look at this beauty:
<?xml version="1.0" encoding="UTF-8"?><kml xmlns="http://www.opengis.net/kml/2.2">
<Document>
<name>track 15_08_2019 06_33_21.kml</name>
<description>Track created by Ultramagic FlightPack - Starting at time 15_08_2019 06_33_21 - Sampling period is 3 seconds - Flight duration is 1 h 8 min</description>
<Style id="path0Style"><LineStyle><color>7f00ffff</color><width>20</width></LineStyle></Style>
<Placemark><name>track 15_08_2019 06_33_21.kml</name>
<styleUrl>#path0Style</styleUrl>
<LineString><altitudeMode>absolute</altitudeMode><coordinates>
15.632430883139,48.4467375744585,314.975244567425
15.632430883139,48.4467375744585,314.918412871592
So the fact that this track starts at Aug 15, 2019 05:33:21 and each point is sampled 3 seconds apart is hidden in a comment – meaning all KML-processing programs will ignore it.
Again, gpsbabel helps into making this mess usable again – it can add ‘fake timestamps’ as starting time and equally spaced for each waypoint – so after getting the clue from above we can do this:
I’ve reported this to Ultramagic last August, asking them to fix it. I got an unpleasant reply. Other than that, Flightpack is still producing nonsense. Thanks, guys!
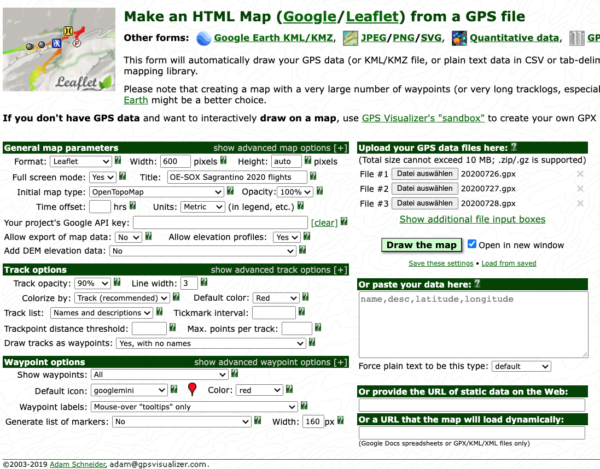
Next step: visit gpsvisualizer and add all processed GPX files in the list of uploads. Also, set the parameters according to this image:
Click on ‘Draw the map’, and download the resulting HTML file. That is what you are seeing above.
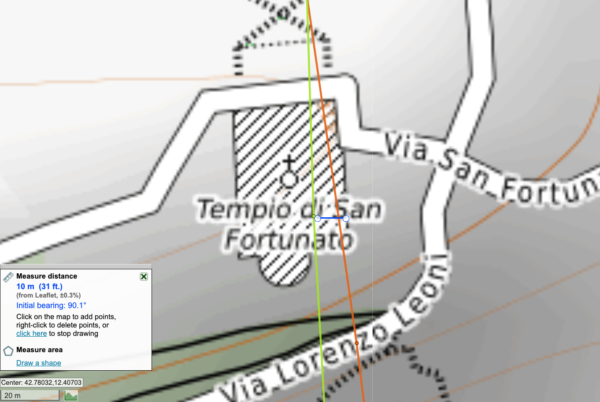
As every year at the Sagrantino Cup in Umbria, Italy, hot air balloon pilots attempt to fly over the town of Todi – situated on a hill and inhabited since Etruscan times. The most prominent feature is the church tower – the Campanile of San Fortunato . And of course, pilots vye to fly right over this tower. This year was no exception – I collected tracks from other pilots and here are the tracks (full screen version):
Matthias and myself came as close as a few meters:
David kindly sent me some pictures from this flight:
Here’s a video from my balloon OE-SOX passing over the campanile:
This is a more detailed followup to my previous post on Sharing & Bookmarking Windy trajectories which should be read first. Since I initially wrote this, Chris has added a ‘Create URL’ section to the traj menu which makes link building much easier – see the ‘Using the Create URL feature’ section. I’ll leave the ‘URL and parameters’ section as reference.
Usage scenarios
Here I describe how to construct windy traj links in detail, and use them in the two predominant scenarios as I see them in the ballooning context:
A pilot bookmarking her favourite location(s) for checking if today/tomorrow etc is flyable and where the trip goes
A meteo briefing at a ballooning event such that everybody receives exactly the same information.
Private bookmarks/links
For 1) I assume the user already has used windy traj before and hence set preferences (levels, models, duration etc) as she sees fit. Those preferences are already stored in a cookie in the browser – next time you’d use traj, those preferences come up again as set previously. Also, that would likely be bookmarks for everyday use, so relative time links as described here would be date-independent and hence could be pasted into a web page.
In that case, all we need to specify is lat, lon, relative time and optionally autostart. Here’s an example minimal time-relative link which relies on cookie settings for levels, models, duration etc – this would yield trajectories for tomorrow 04:00UTC whenever called – go ahead, copy this, paste it into a new browser tab’s address field and see for yourself:
For 2) , it’s more relevant that everybody receives the same information – so absolute time, pre-set models and levels are more used. In that case, I’d use a link which exactly lays out all relevant options:
This would create trajectories for August 8, 2020, 04:00 UTC only, using the iconEU model, and the levels listed above. Also, duration and sampling intervals are set explicitly. Clicking this link would yield the exact same screen result for each user regardless of the users’ own preferences set before.
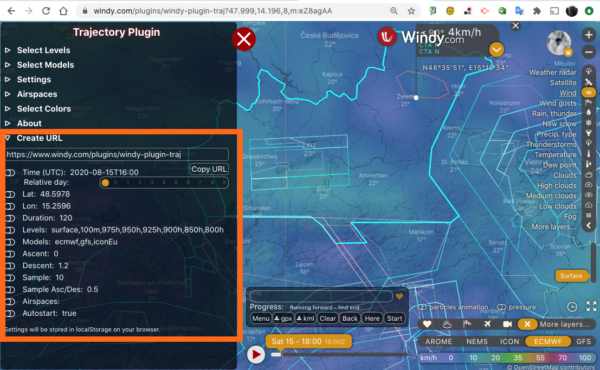
Using the Create URL feature
There’s a new section in the expanded menu on the left side – it makes the export of a custom URL like outlined above really easy. Instead of manually creating a URL as shown in the reference section below, you use the traj settings options per se: set location by moving the location marker, set time by setting the time selector, choose models/levels/duration as you would previously.
Then, go to the ‘Create URL’ section and set those portions which you want exported, including setting absolute or relative time.
Hover over the URL box just below the ‘Create URL’ header, right-click, copy link address, and your custom URL is copied to the clipboard ready to be pasted into HTML, opened or added to a bookmark!
Here’s a step-by-step example how to create a bookmark for tomorrow morning’s trajectories:
Update: Try the ‘Copy URL’ button – in the video I had used right-click/copy link address because at the time the ‘Copy URL’ button did not work properly. It does now.
Eating our own dogfood – the links in this page have been updated using the method outlined in the video.
Does it work on my laptop/pad/mobile?
laptop or PC:
Apple macOS: Safari, Chrome, Brave, Firefox – no issues
Windows 10: Chrome, Edge, Brave, Firefox – no issues
Linux laptop: untested, but likely OK with Chrome or Firefox
Pads:
iPad (as of iOS 13.6.1): no issues with Chrome, Safari
Google Nexus 10 (Android 5.1.1): works fine with Chrome
Mobile phone:
Samsung Galaxy S10 (Android): works fine with Chrome
iPhone X (iOS 13.6.1): broken – currently does NOT work with any browser
So the iPhone currently is the only platform where traj linking does not work. It’s being looked into – what happens is: if you click a link the Windy app opens instead of a browser tab, and the app is not capable of running plugins.
Reference: URL and parameters
The URL begins like so:
https://www.windy.com/plugins/windy-plugin-traj?
and is followed by the parameters, which are key/value pairs of the style ‘key=value’ or ‘key=value,value,value…’ in case of lists of values. Key-value pairs need to be separated by an & (ampersand) character.
For reference, here are all the URL parameters supported by the windy traj plugin:
Chris (of windy traj plugin fame) could not join my team for the Sagrantino Cup balloon event due to the pandemic. But he used the time to improve traj – and it has improved a lot!
Speedup
Previously, generating trajectories for many altitudes and several models could take quite a while – since every calculated point would need an interaction with the windy server backend. Chris changed this so the relevant data tiles are downloaded once into the browser and all path calculation happens locally in the browser. Now it’s as fast as Meteoblue!
Sharing trajectories
“Look, tomorrow looks flyable!” – a common message, and then.. attach what? a screenshot? a GPX or KML track? What I did so far is: download the trajectories as GPX tracks, then massage them with gpsvisualizer.com, download the resulting HTML file, upload that file to my server, and share a link to that file – for example, like so. That’s quite tedious, and precludes the recipient from running traj with the original parameters but later (for updated forecast values) or different parameters/models.
Chris has now added this capability and it has turned out super useful. Before trying yourself, read the restrictions:
this only works with a real browser – to make it work on a mobile or pad, you need to copy the link, and paste it into a browser
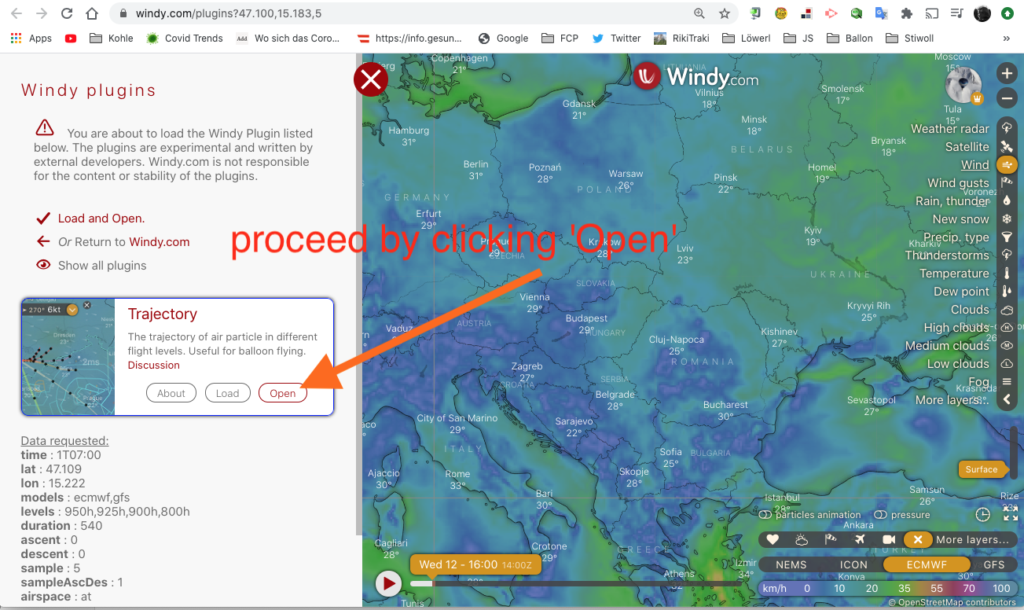
once you open the link, you’ll see a popup – acknowledge it by clicking ‘Open’:
You saw the popup pane on the left side, and me clicking ‘Open’ to proceed.
The traj plugin came up, with parameters pre-set, like location, models, altitude, duration and so forth. And starting time – more on that later.
The trajectory computation automatically started and the window centered and zoomed such that all tracks are visible – all I had to is pan out a bit so the detailed map is hidden. Done!
Let’s dissect the link above and look under the hood:
The first part of the link (https://www.windy.com/plugins/windy-plugin-traj) up to the first question mark calls the windy website and tells it to open the traj plugin. That part causes the popup you saw in the image and video above.
The rest of the URL consist of normal parameters of the style key=value and separated by ‘&‘. Most of them will be self-explanatory – like lat, lon, models, levels, duration and so forth – the start=true parameter causes immediate calculation of the tracks as soon as the plugin is loaded. It’s equivalent to clicking the ‘Start’ button in the small traj menu box.
The time parameter is always interpreted as UTC (Zulu time) and can be one of two flavors:
an absolute date and time like time=2020-08-13T04:00– August 13, 2020, 04:00 UTC
a relative date and time like time=1T04:00 meaning tomorrow 04:00 UTC (for today use ‘0T<time>’, for day after tomorrow use ‘2T<time> etc)
I’ll write up a detailed parameter description eventually but I’ll let things settle down a but first – all this is rather fresh code. Note that the parameters from the URL are shown in the initial popup.
Why use relative time?
Well, the nice part of a relative-time URL is: it never changes – tomorrow always means ‘tomorrow’, but 2020-08-14T04:00 means ‘tomorrow’ only today as I am writing this. So you can paste a link for ‘tomorrow morning trajectories’ or ‘tomorrow trajectories’ in a website. And: you can bookmark them and name them.
So next time you want to know if tomorrow is flyable: click on the ‘tomorrow morning’ bookmark which has all your favourite settings, and you’re done!
Friday Jan 24 had great weather for a balloon ride across the Dachstein when taking off from Filzmoos. I had a GoPro Max 360° camera mounted to catch what became a stunning ride:
Today several balloonists “went across” – for a long distance flight over the Alps.
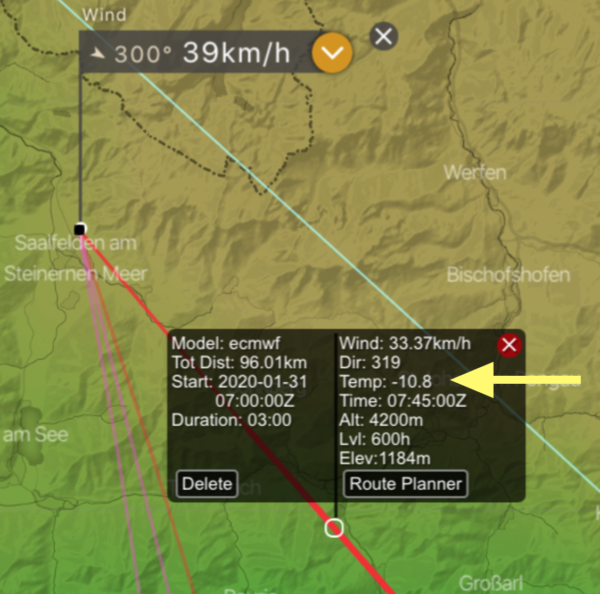
Here is one track flown compared to the forecast I did with windy traj with the ECMWF and iconEU models. Note that takeoff was at 0600Z but the forecast was for 0700Z. Most of the flight was around 2800m altitude, so the 3000m/700hPa tracks are the closest match (you can disable the irrelevant altitudes by clicking them away in the top right box).
The track is mostly right between the ECMWF and iconEU forecasts. Also, note the accuracy of speed forecasted – click on some track points and the rings of the forecasts to see the values (click here for full-screen display):
It covers the basics – organizing your layers and preferences, plugin use, and using geopotential height forecasts for early spotting of long-distance flight opportunities.
Drop me a line if you find errors, or have suggestions for improvement.
selecting between accuracy and speed: using the ‘Layer Interpolation’ switch
Let’s go through these in turn:
Temperature along a path
Once you have created a path, click on a point along the track. The popup shows the forecasted temperature at this location – useful for the loading calculation, and planning proper clothing:
the outside air temperature displayed along the path
Tracks downloaded as KML or GPX files will carry along temperature values except for ECMWF-generated tracks. You can see the temperature forecasts in windy, but due to licensing constraints the values are not exported for ECMWF.
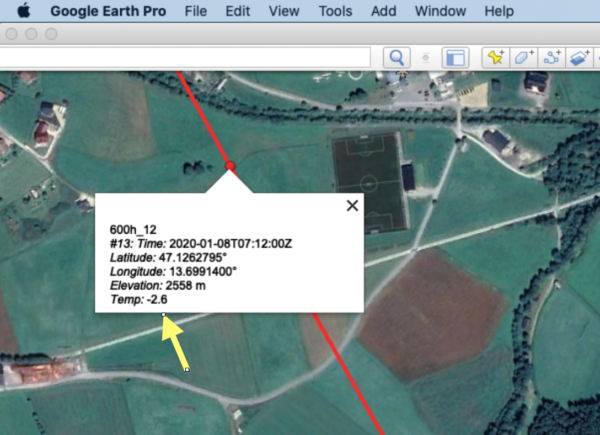
Not every program which reads GPX files actually can display these values. Barring a better alternative, exporting in KML and reading in Google Earth will display temperature values:
Google Earth will show temperature values when importing a windy-traj generated KML file
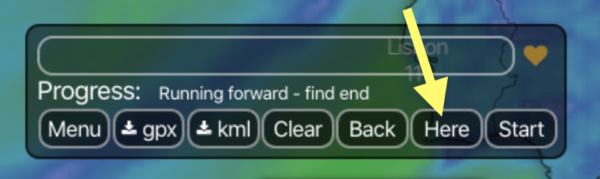
Here: warp me to where I am!
On a recent balloon ride we had to decide wether to rise, descend, or stay level to reach a certain target. Since we had mobile Internet coverage, we used windy to re-generate trajectories for different altitude choices.
As always, you need a starting location. So that’s what the ‘Here’ button does: It will retrieve your current location, set the location picker, and – if an altitude value is available – set the next matching altitude.
I got a field report today from a gas balloon ride that this feature works exactly as advertised.
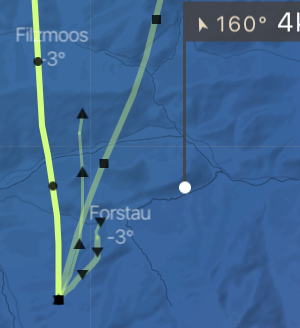
Model-specific markers
Generating tracks for several models and altitudes easily makes for a cluttered screen. So far, all tracks were marked with black circles in (by default hourly) intervals. All trajectories of a given model now have distinguishable black marker icons:
ECMWF – circle
GFS – rectangle
iconEU – triangle, upward pointing
nems, namConus – triangle, downward pointing
Selectively displaying altitudes and forecasts
Selecting several models and altitudes easily makes for a confusing screen. Chris added the capability to selectively turn on/off tracks by model and altitude. To do so, the menu needs to remain open – then, clicking models and altitudes will (de) select the display of the corresponding forecast track (click here for a full-screen version):
Addional forecast models: NEMS and namConus
This version adds two models:
namConus (North American Continental US), 5km grid, by NOAA, some 3 days lookahead)
NEMS by meteoblue.com, 4-12km grid, based on NOAA model with meteoblue extensions added, claims to be strong in Alpine areas, 2 days lookahead, ground up to 1500m (850hPa)
namConus seems generally useful for ballooning purposes and adds a third model for the North American continent in addition to ECWMF and GFS.
NEMS, however, looks rather restricted for aviation purposes as currently available in windy.com – lookahead two days only, and covering altitudes only up to 1500m, which makes it useless except for rather mundane flights. As it stands, this is not a replacement for the meteoblue trajectory function, which covers higher altitudes as well as six days lookahead – for a fee.
Note that NEMS trajectories currently only work with the ‘Layer Interpolation’ option selected – see next section.
Selecting between accuracy and speed
This version adds a switch in the menu: ‘Read data with:’ being ‘Data Loader’ or ‘Layer Interpolation’, with ‘Data Loader’ being the default.
If exploring NEMS trajectories, remember to select ‘Layer Interpolation’ or you will see a message ‘No model’ displayed. Also, remember – NEMS currently only works up to 1500m.
The way I understand this switch – it is a tradeoff between speed and accuracy. Layer interpolation works much quicker (almost an order of magnitude) but sometimes gives odd result.
My recommendation: if exploring many altitudes and models, it might make sense to select Layer interpolation initially, and to switch to Data Loader once you drill down to a smaller set of altitudes and models, yielding more accurate results.
Geekspeak: The Road Ahead (coders only)
Chris tried hard to accelerate trajectory computation, and the Data Loader/Layer Interpolation knob is a step in this direction. But at some point it might make sense to move work to the windy backend.
Right now all the work is done in the browser, but each data point needs a server interaction to retrieve a new value set – which slows things down considerably. That, however, is currently beyond the limitations of the windy plugin model, and would need a way to add user-contributed code to the windy server backend in a safe fashion. I understand things might be moving in this direction.
That said, let me stop the nit-picking: compared to the rest of the crowd, windy.com is a phenomenal step forward by making a weather application user-extensible and hence adapted to specific needs!