Update: head over here for the current version of the trajectory function – the text below documents plugin versions below 0.5.1.
windy.com is a phenomenal resource for weather forecasting. It’s less of a “will it rain at X by Y” type app but rather a data viewer for many different layers of information – you will have to draw your own conclusions. It also sports a variety of forecast models (among them the $$$ ECMWF) – for free. And it supports user-written plugins for specific purposes, which has unleashed a lot of creativity by weather-affine geeks.
For balloonists, the traj plugin is very useful – it can create tracks to answer the question “If I start at X and fly level in altitude Y at time Z, which track would I fly?”. And it can answer this according to several weather models – in Europe that’d be ECMWF, GFS and ICON-EU.
Here’s a short how-to for generating trajectories:
- The traj plugin currently only works on desktop browsers – not (yet) on mobiles
- The plugin must be explicitly loaded after pointing your browser to https://www.windy.com/ : click on the top left “Hamburger” (three horizontal bars) icon. In the dropdown, click “Install Windy plugin” and scroll down until you find the “Trajectory” plugin – then click on “Open”.
- two windows will appear – one with explanations and one for parameters.
- Select altitudes and duration in the parameter window.
- Set a start time using the time selector at the bottom of the screen.
- Select a model (ICON, ECMWF or GFS) in the right bottom model selector.
- Choose a start location – either by clicking on the map window (the “picker”) or choosing a favorite by clicking the heart icon in the parameter window which will present a dropdown of your favorite locations
- click “Start” – which changes the label on this button to “Stop”
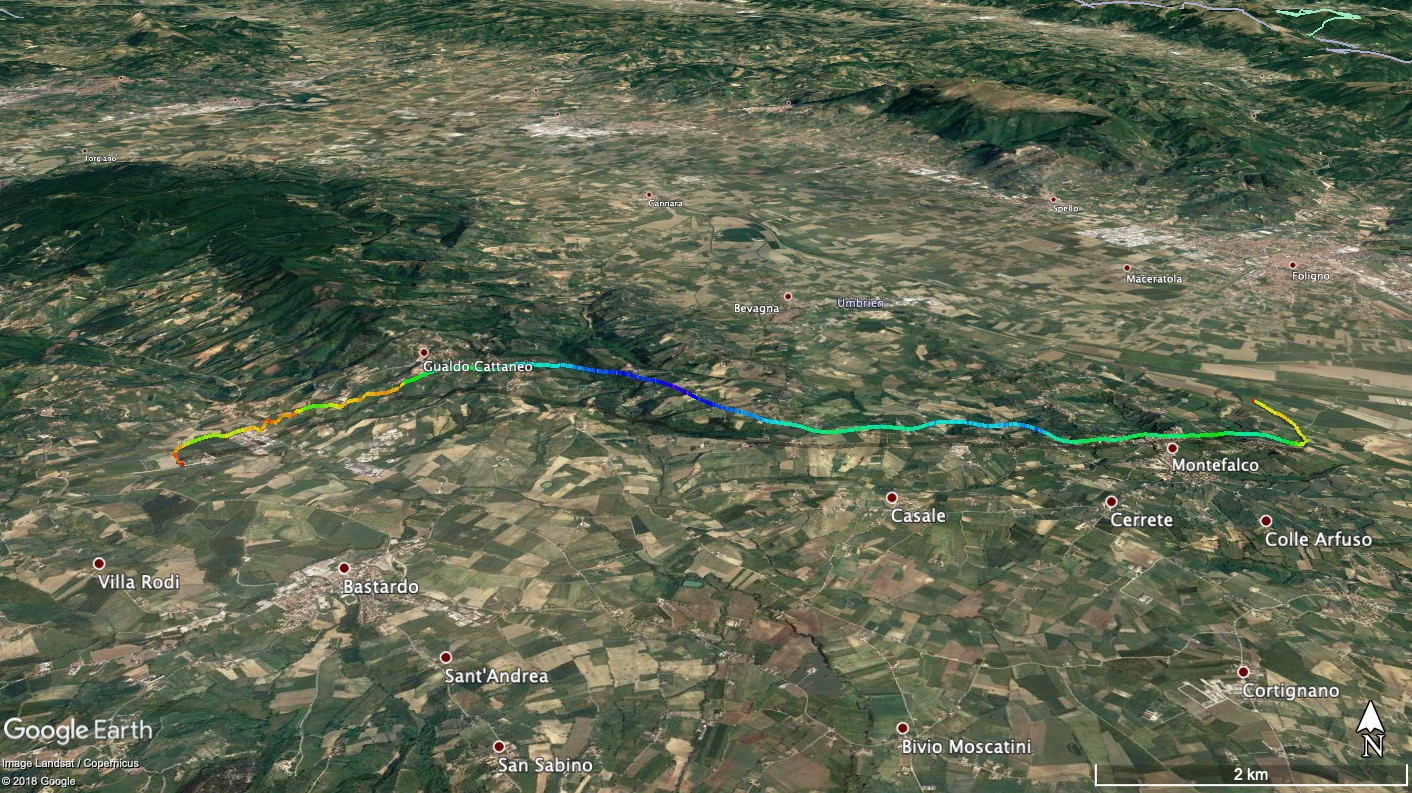
- the progress can be seen on-screen as the curves are drawn
- the black bullets denote hourly intervals
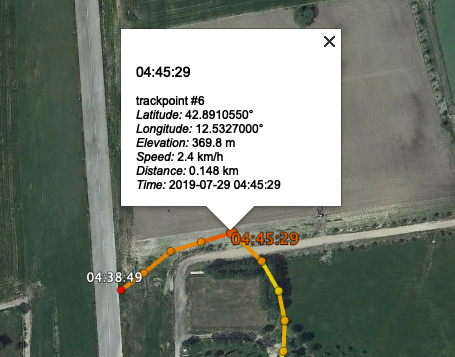
- Click on the lines, or the bullets for detail information (time, speed, model, model generation time etc)
- when the plugin is done, you can download the trajectories as GPX files by clicking “Save”
Advanced features include:
- simulation of ascent and descent – if set to zero, just level flight will be simulated
- backwards trajectories – those answer the question “If I want to go to location X, where do I need to start?”
- duration of the trajectory: up to 240 hours – useful for gas balloon flights
For a discussion of the features and for reporting errors, see the Windy community website topic on the traj plugin.
For the curious: an example GPX file generated by the traj plugin
For geeks: here is the plugin code.