
Introduction
We are happy to announce the release of windy-plugin-radiosonde: extending windy.com to display weather balloon upper air sounding data.
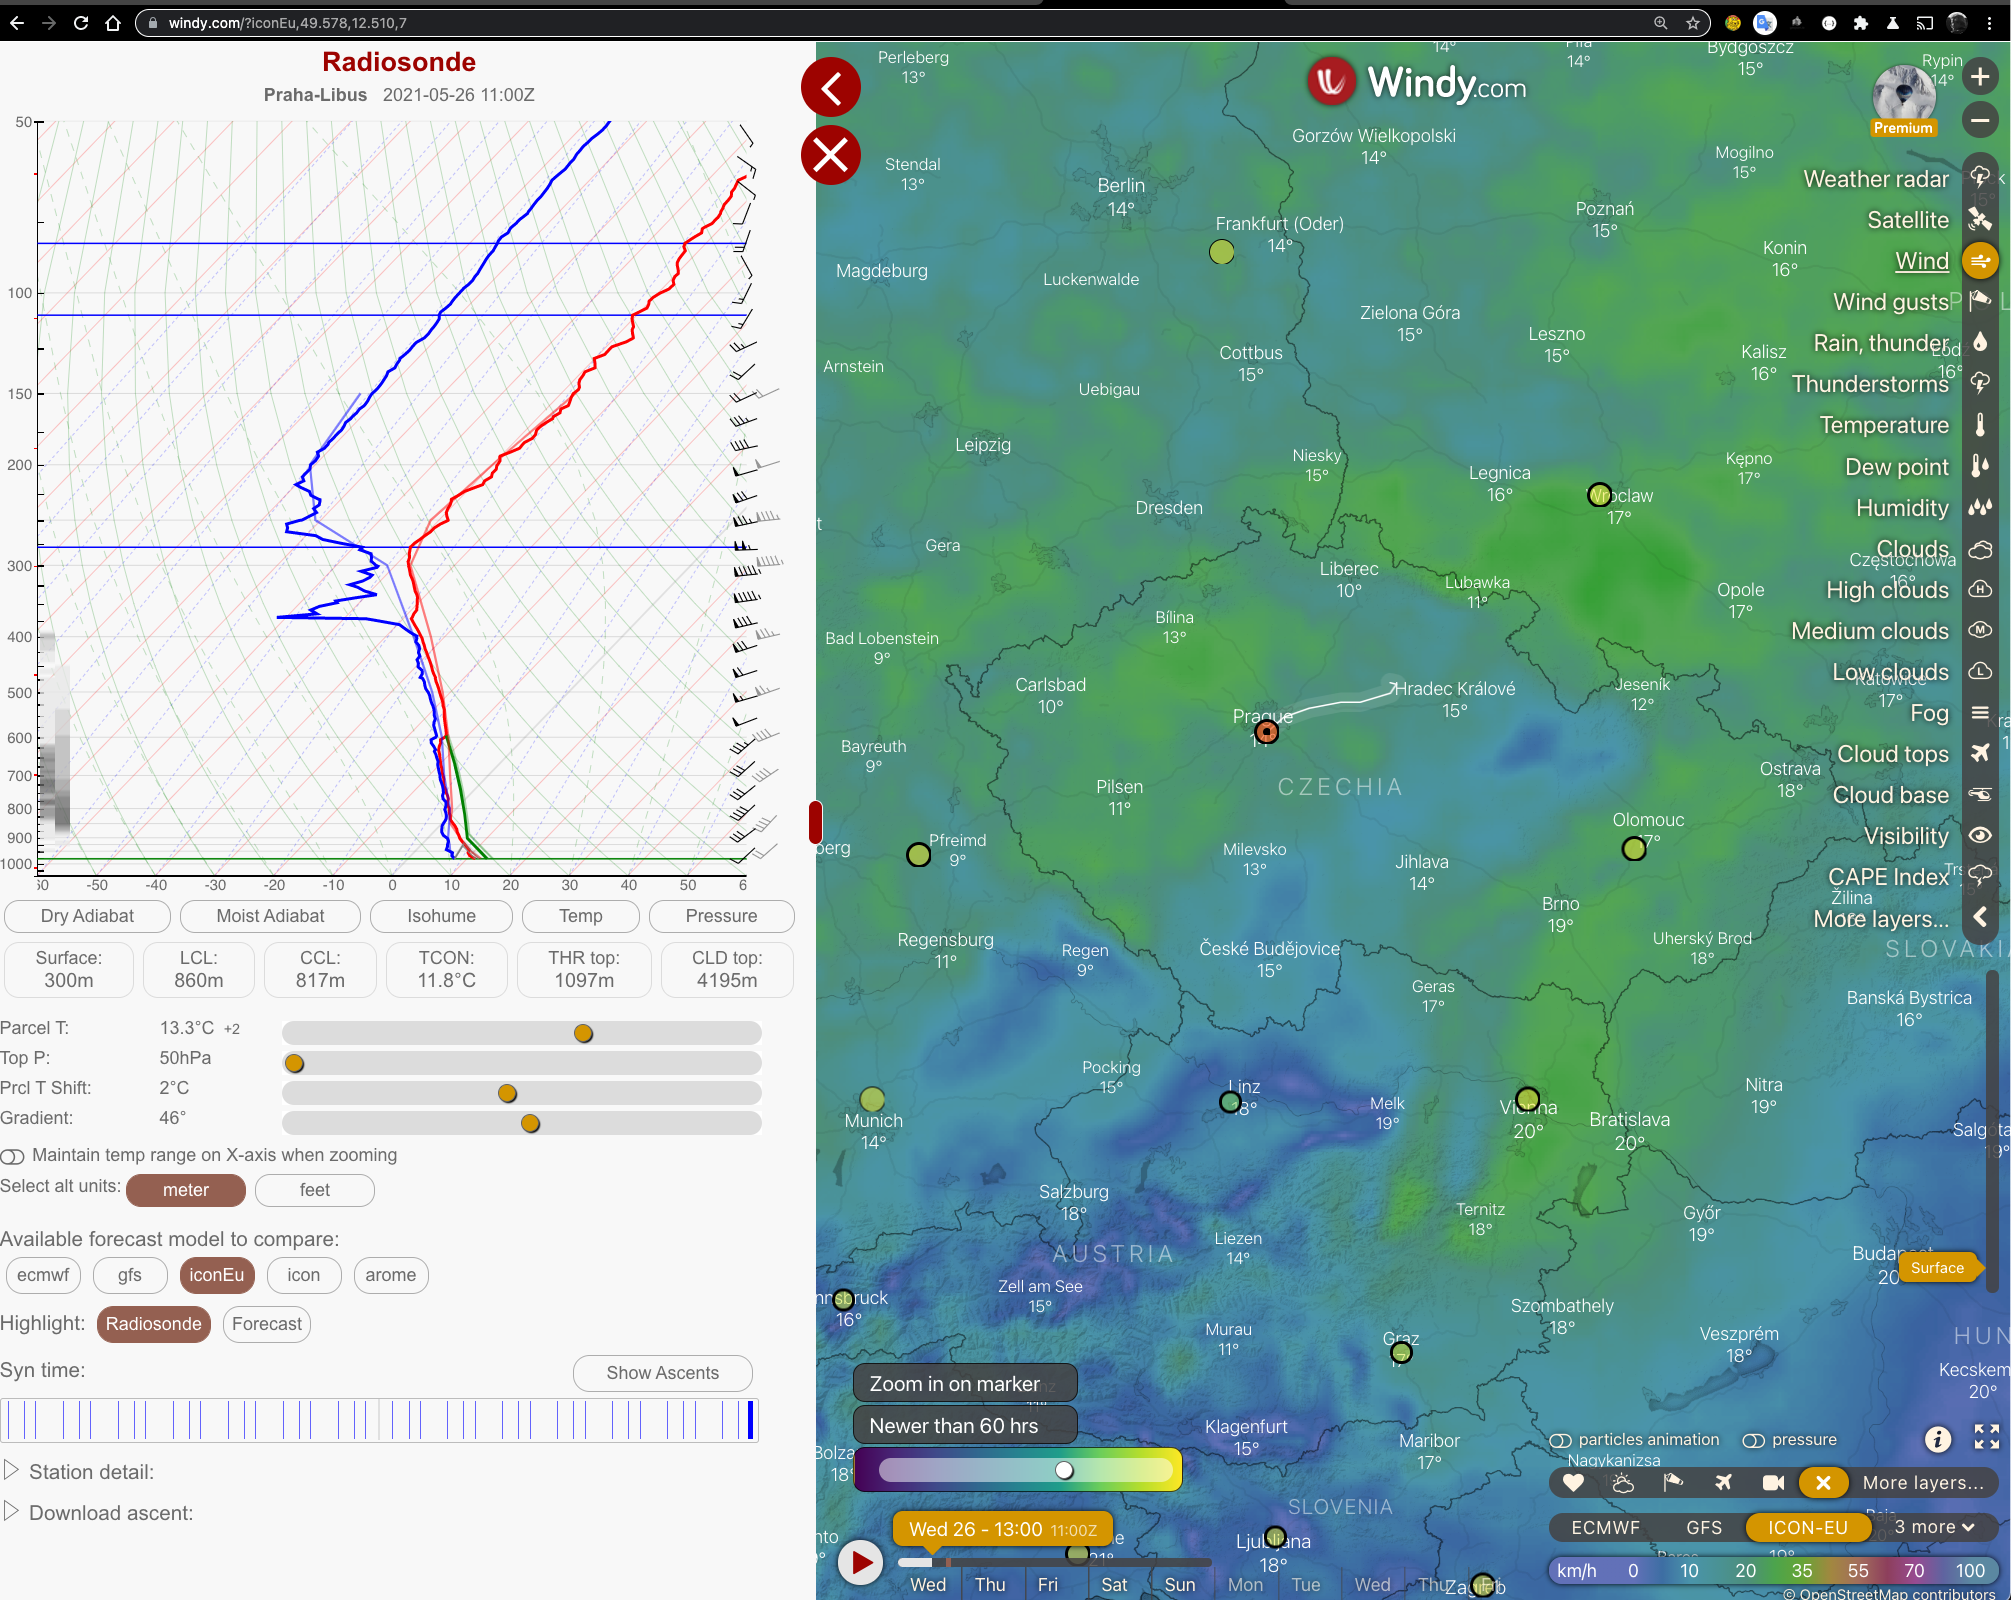
Screenshot in action:
What does our plugin do?
- Radiosonde (weather balloon) ascents from all over the world, for the last 2 weeks, are indicated on the map.
- Click on a station and the most recent ascent will be plotted on the skew-t chart.
- A white line attached to the marker, indicates the trajectory of the radiosonde. You can drag the black dot along the trajectory and the tooltip will follow, or drag the tooltip on the skewt chart and the black dot will follow.
- The
Syn Time(synoptic time) slider allows you to select a previous ascent. - If the ascent occurred within the last 6-12 hours, historical forecast data may be available. These will be indicated under
Available forecast model to compare. Theecmwfdata will be displayed by default if available. The forecast data is then superimposed on the sonde data, so that you can compare the accuracy of the different models. Todo: Interpolate the forecast data to match the sondedata point timestamps. - You can highlight either the Radiosonde or Forecast data with the highlight selector.
- The chart tooltip will display the data of the highlighted plot.
- If you click on the map (not on a marker), the picker opens and the forecast data for that location is shown on the chart. (Same as the
better soundingplugin). If you change models or time, the plot will update.
Demo video
Our plugin is now in the list of featured plugins and can be directly opened using this link: https://windy.com/plugins/windy-plugin-radiosonde
More about the chart:
- Plots data on a skew-t chart.
- The background gridlines are: temperature (skew), pressure (horizontal), isohume, dry adiabat and moist adiabat lines. Each of these gridlines can be highlighted with the buttons beneath the chart.
- The red line indicates the temperature at different levels, the blue line the dewpoint at the different levels, the green line indicates a rising air parcel from the surface. Wind barbs are displayed on the right, and clouds displayed on the left, dependent on rh (or the rh calculated from dewpoint). For this chart: Sonde data clouds and wind barbs are left and forecast data on the right.
- You can pan the chart left and right.
- The following can be set with ranges:
- The surface parcel temperature, by default this is 2 degrees more than surface temp.
- The top pressure of the chart, by default this is 50 hPa, by setting this to a higher pressure, you can zoom in.
- Parcel temp shift: By default the surface parcel is shifted 2 deg higher, the default can be increased or decreased. If you click new marker or spot on the map, the surface parcel temp is reset to surface temperature plus
parcel temp shift. - The gradient of the chart, default is 46 deg, for this chart equivalent to the vertical ELR. (This is probably not really useful just cool to play with).
- The following information is calculated and displayed below the chart:
- Surface elevation, obtained from Windy.
- LCL: Intersection of the isohume line (dewpoint lapse rate) and the dry adiabatic lapse rate.
- TCON: (Convective temperature, Release temperature or Auslösetemperatur): The surface temperature that must be reached to start the formation of convective clouds by surface heating.
- CCL: Should the TCON be reached, the CCL indicates the cloud base of convective clouds. This is the intersection of the isohume line and the temperature line.
Thermal top: The top of the thermal reached, for the selected parcel temperature. This is indicated by the top of the green line, following the dry adiabatic lapse rate.- Should convective clouds form (thus the isohume line from dewpoint and dry adiabat line from surface parcel intersect, the lapse rate will follow the moist adiabat line), the
Thermal topthen equals the cloudbase. TheCLD topwill then indicate where the evaporating parcel stops rising.
Other features:
- You can view the detail of the ascent.
- You can download the ascent data in different formats. (Note this is NOT forecast data from Windy, but historical data).
- You can zoom into a selected marker.
- If you move the time bar at the bottom of Windy, the markers within 90 minutes of the timestamp will grow larger.
- The
<at the top collapses the left pane, you can reopen it from the button on the bottom left. - The
Xcloses the plugin completely and removes everything from the map. You can then reopen it from the context menu, the marker summary data will then be redownloaded. - The plugin pane on the left can be resized, on desktop and tablet.
- You can open the
meteogram/airgramplugin (down-arrow of the picker), and the radiosonde plugin will remain open.
Backend service
The backend collects data from several “official” meteo sources around the world, among them:
- GISC Offenbach through its Deutscher Wetterdienst open data portal service
- NOAA GTS
- GISC Moscow
- GISC Tokyo
- Meteo France
- NOAA MADIS through its MADIS service
Currently we see about 730 active stations providing on average data for 2 ascents per day. We keep a history of 14 days of recent ascents, as well as the underlying source files as provided by the organisations above (see the Detail button in the chart).
Ascents are distributed in two different formats and that shows in the radiosonde plugin:
- the ancient telex-oriented FM-35 TEMP format
- the more recent FM-94 BUFR TEMP format
About a third of the ascents are in the high-resolution FM94 format. The rest is FM-35. Ascents available in FM-94 format are indicated by a fat ring marker, a thin ring around the marker indicates an FM-35 format. On the atlantic you might notice the occasional ship symbol – those are ascents supplied from weather ships.
Ascent data can be downloaded via the Download dropdown in either CSV or GeoJSON format. See here for a usage example.
The backend currently runs on Michael’s private server and should be able to provide decent service for a while. Michael gives a support promise of 2 years to keep this service running, and is happy to find adopters to pick up this service in a more professional context.
The backend consists of mostly Python code and a few shell scripts. It is just plain files in a hierarchy. The overall design principle is “1957 Chevrolet” – no service or database which can break, idempotent operations, and nginx serving files.
While easy to replicate the setup, getting the data feeds is decidedly nontrivial. You have been warned.
Some notes on the backend can be found here.
Extension ideas
- The ascent data could be used as base for trajectory forecasts, provided temporal and spatial proximity of an ascent to the intended flight.
- There is live radiosonde data available through a network of radio amateur receiving stations, and this could be integrated to provide more timely information.
- Collecting all sonde paths in vector map tiles, indexed by time. This would enable scrolling through all the sonde paths in one go like through a vector wind field (I wish the windy time selector could go backwards)
A radiosonde launch
Nowadays many radiosondes are launched automatically. Here’s the Vaisala Autosonde launcher in action.
Final comments:
- This is work in progress and we’ve been working on it for several months, there are still some bugs.
- Chris has tried to use native Windy UI classes etc and styles as far as possible.
- We are not meteorologists (except Heidi), and would appreciate input.
- It works well with the new Windy
Thermallayer. - Enjoy.
List of moving parts:
- The windy radiosonde plugin
- The backend data collector
- A Javascript reference application, not intended for general use
Issue reporting
- for the plugin please use https://github.com/rittels/windy-plugin-radiosonde/issues
- if clearly in the skewt display code, please use https://github.com/rittels/skewt-js
- for any backend functional issues and feature suggestions please file an issue at https://github.com/mhaberler/radiosonde-datacollector/issues
Team and contributors
- Chris wrote the plugin and adapted the skew-t chart from https://github.com/dfelix/skewt-js.
- Heidi Schmid provided meteorological advice and adult supervision.
- Michael Haberler created the backend: an aggregation of radiosonde ascent data from different sources all over the world.
- Victor Berchet allowed us to use the better-sounding formulas for plotting some of the background and parcel trajectory. Chris added some functionality.
- Guillermo Ballester Valor – who runs the venerable ogimet.com service -provided key advice on NOAA data handling and we use his bufr2synop package.
- John C. Kealy provided the original inspiration with his skewt plugin.
Many people have provided help and advice navigating the abyss of public meteo data. In particular we would like to thank:
Larry Oolman of University of Wyoming
Michael Pichler of Austrocontrol
Elena Averyanova of GISC Moscow
Reto Stauffer of University Innsbruck
Piero Serra of Italian Air Force Met Service
Nadja Schneider of DWD Offenbach