Kolja Packard was member of the ground support team for the Belgian, Spanish and US teams at the Gordon-Bennet-Cup 2019 – the most prestigious gas ballon race in the world. He used – among other tools – windy.com and in particular traj – the trajectory plugin – to aid pilots with weather information and tactical advice.
Kolja writes:
Experiences with the Windy Trajectory Plugin
Hello Michael,find below a summary of the experiences and impression of the trajectory plugin for windy.com. I used it in the – rather particular – setting of planning and supporting a long-distance (and long time!) race with gas balloons during this year’s Gordon Bennet race starting from Montbéliard.
Usually with gas balloon rides a duration of 6-12 hours is of interest. But in competitions, flights lasting several days are possible. With this year’s Gordon Bennet Race – which is about maximum-distance-flown, due to the overall weather situation, flight times of up to 72 hours and much more were possible.
For the average – and much more common – hot air balloon pilots flights of around 1-3 hours in the morning and in the evening are more typical.
We looked into possible tracks while supporting three teams (BEL1, ESP1 and USA1) and those were quite long-lasting flights. Our strategy – and therefore the search for relevant information – looked at 80 hours onward from the start even before takeoff!
By using windy’s traj plugin, we gained the following advantages:
1. trajectories based on additional weather models – only windy could provide data for ECMWF and IconEU beyond the GFS-based HYSPLIT and the GFS-derived NEMS model by Meteoblue
2. it was straightforward to model long duration trajectories with changing altitudes and represent those in a single screen view
ad 1) especially during diverging forecasts there is value in having data from different models at hand, so as to get at least a rough tendency of weather development
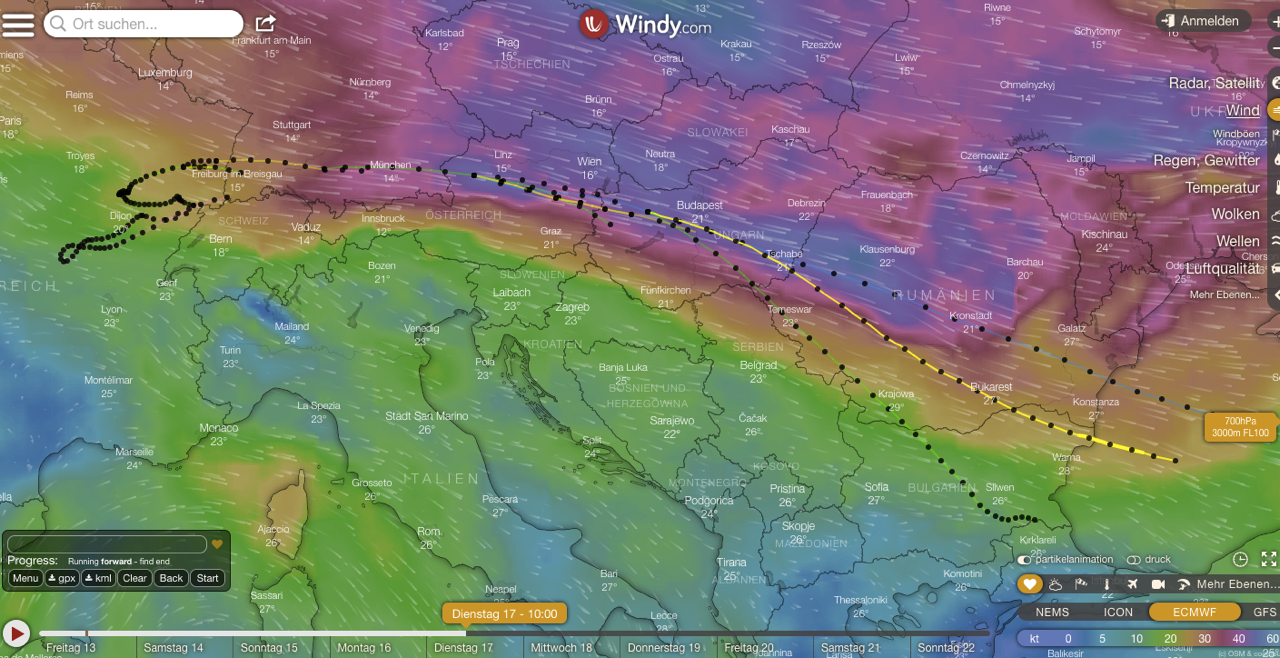
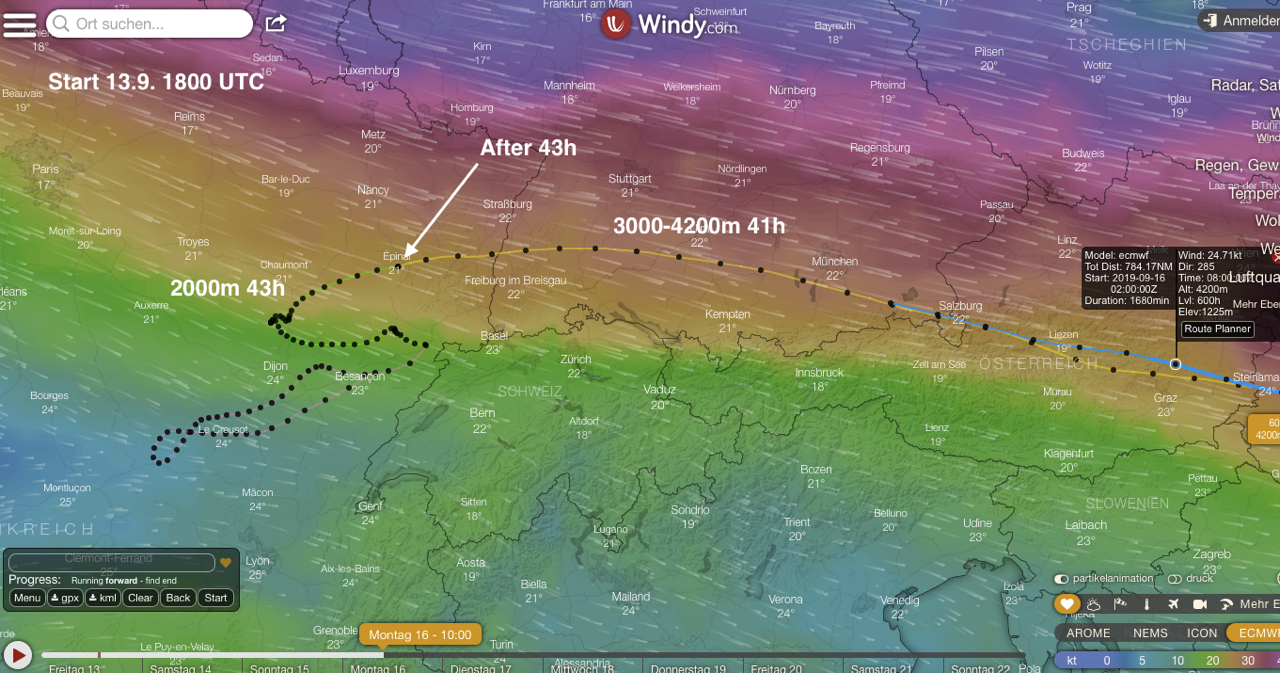
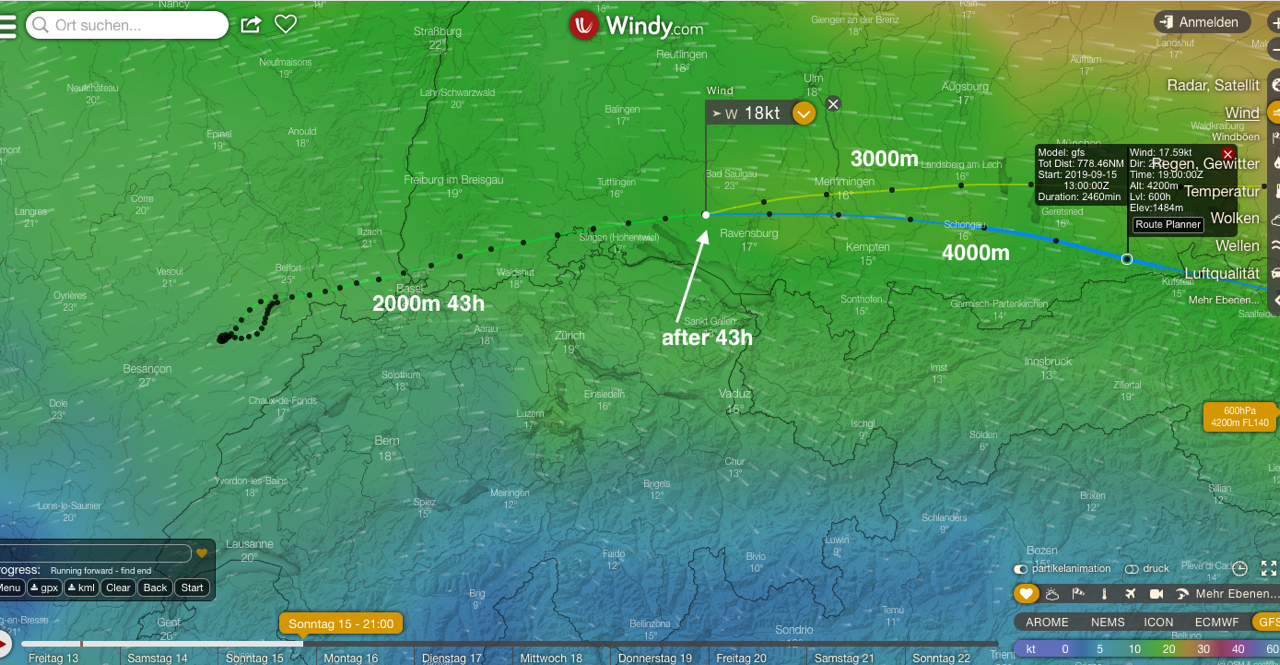
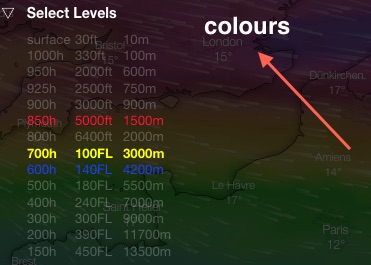
ad 2) example below: multilevel trajectory produced 22 hours before takeoff (actually this are 4 partial trajectories following each other with different altitudes assembled into a single view):
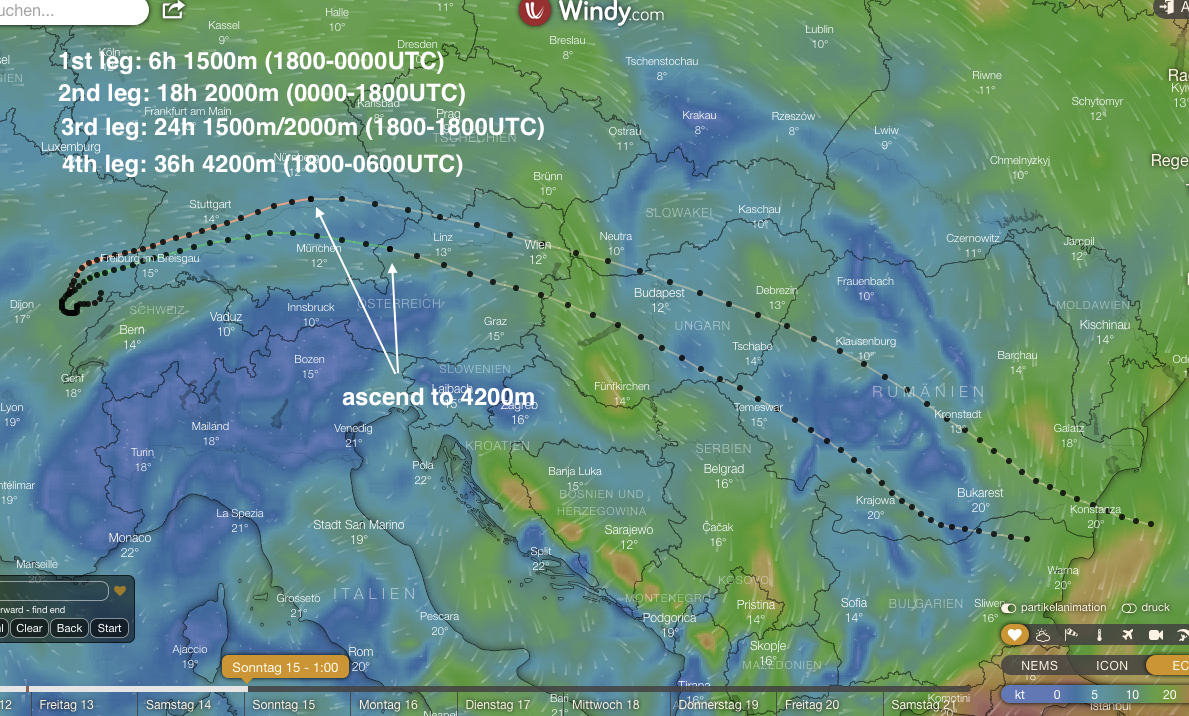
Detail view of how partial trajectories are assembled:
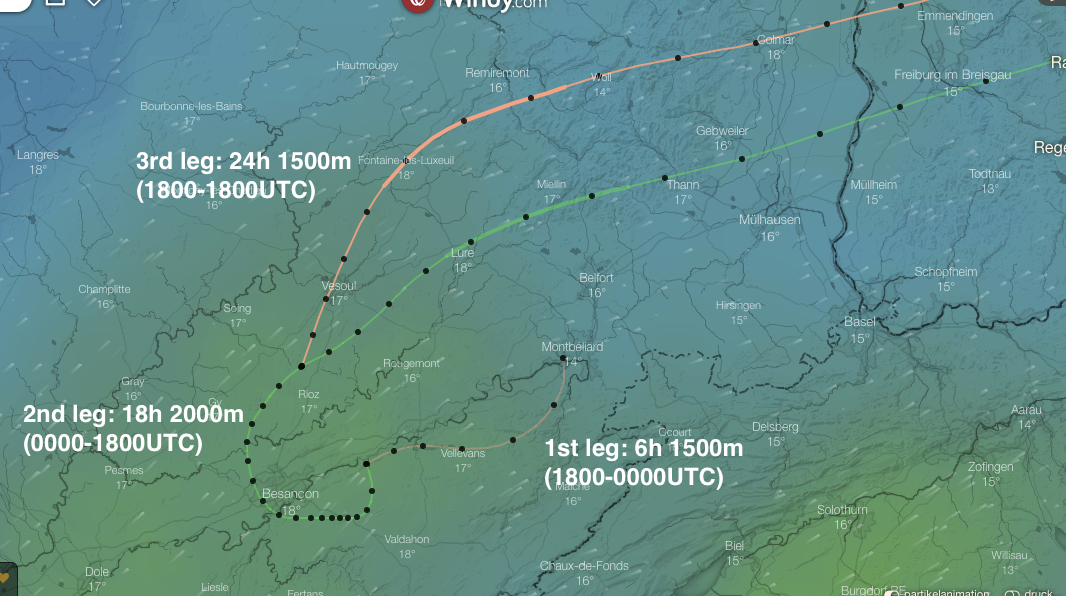
For developing such a “multi-level trajectory”, you start with a single parameter set (height, model etc) and just start another trajectory at a certain point with a different set of parameters.
One can add aribtrary trajectories at arbitrary points of an underlying trajectory so as to estimate the impact of altitude changes at different points into the flight given a location, and develop a strategy based on the result.
I did not use the ascent/descent simulation provided by the traj plugin – trajectories at a given altitude for extended periods of time were more relevant to us.
Further into the race, we were faced with short-term decisions beyond the long-range planning. Here some features of the traj plugin proved useful.
For instance, for short-term forecasts the age of a forecast is relevant – it makes a difference if it is a new iteration or several hours old.
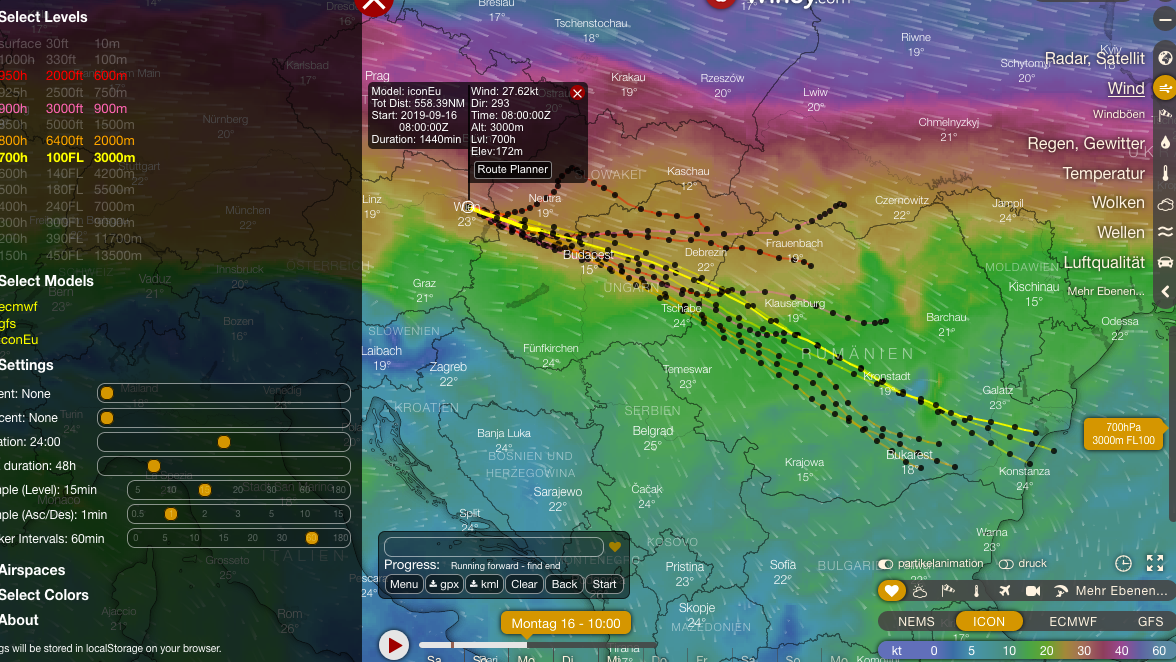
There was no clear “winner” in terms of models as for accuracy – generally the ECMWF model provides reasonable results, on short-term IconEU also got some best suiting forcasts to actual conditions.
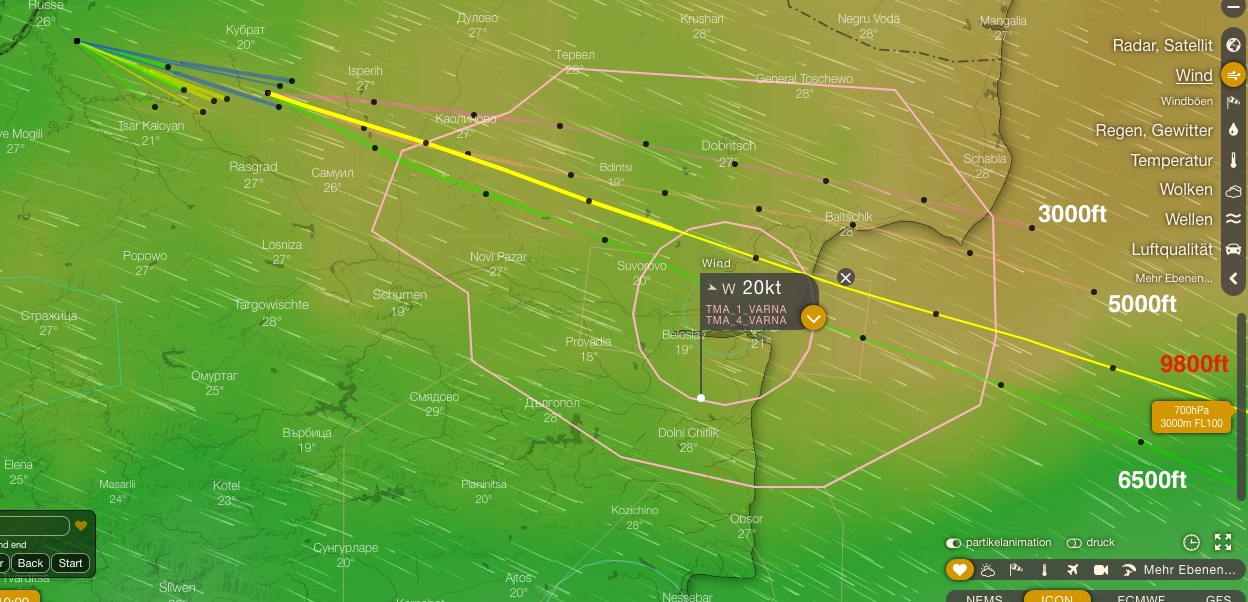
Adding airspace information to trajectory tracks is very helpful (even if available as a separate windy plugin).
The following features proved useful:
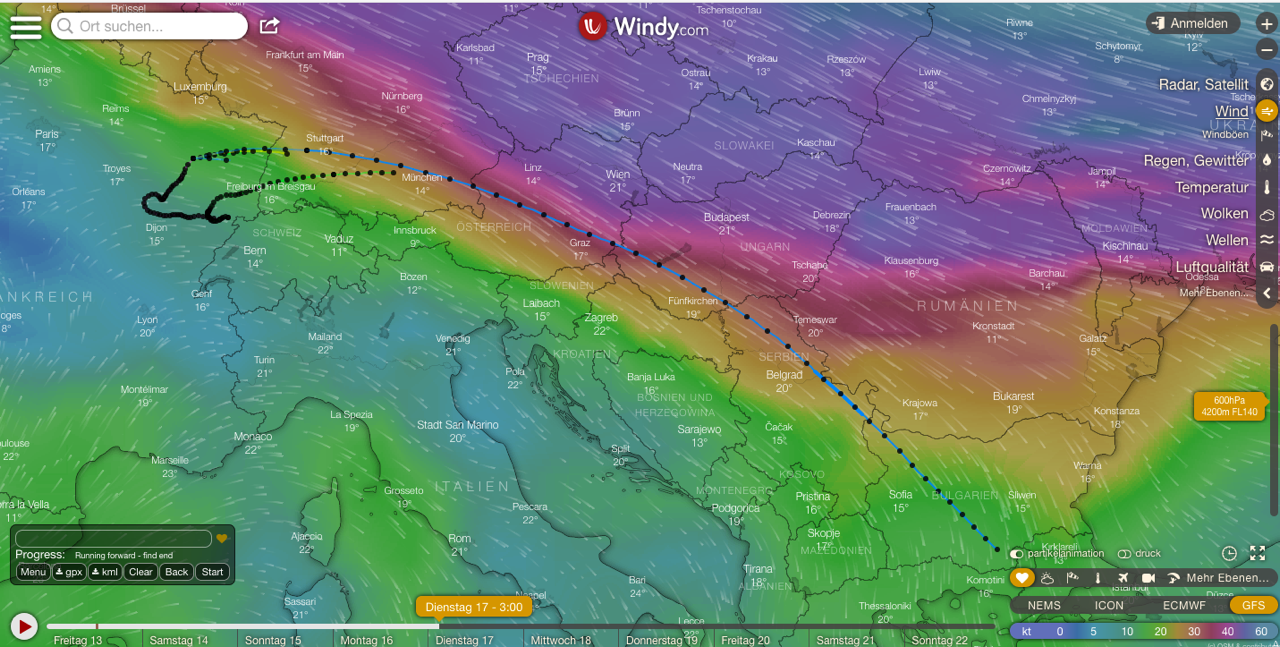
– the resulting trajectories can be overlaid with all data provided by windy. By clicking on a point in a trajectory, forecast time is automatically adjusted, as is the altitude. That makes it straightforward to estimate conditions at a certain point into the flight.
– map display in windy is very flexible, for instance scaling and import of non-standard geodata.
– exporting trajectory data from the plugin is very useful.
During intense use of traj, I’ve encountered some restrictions and issues, and I have some suggestions for further development.
I encountered two issues during 5 days of use – which I generally would rate as “explainable”:
1. Looking ahead over 40 hours, I ran into a problem with IconEU – forecasts got stuck some 3 days into the future – the site got stuck and required a restart in a new browser window.
This did not occur with other models, and also did not reoccur during later phases of the flight when we only looked at shorter time spans.
2. On and off the trajectory computation appears delayed as – according to a message on-screen – there was no connection to the server. Certainly this is attributable to our makeshift Internet hookup for our “Control Center”. Nice to see that the job did not fail but rather eventually continue once network connectivity was reestablished. And this is only was an issue because it took quite some time to compute the trajectories – more below.
The only real downside to the traj plugin – and then only compared to some commercial alternatives and when computing long-lasting flights, and therefore not neccessarily felt by many users is its low speed of computation.
In particular, when using multiple models over an extended period of time, the job might take 10 minutes or more. But if I understand it right, the traj plugin just queries wind info on the current location and time from windy and trajectory computation happens locally, not on the server.
Given 3 models, maybe 3-4 altitude levels and – for example -40 hours lookahead, that’s 480 data snapshots taken by the client, and that takes its time. And I had to forecast 80 hours in different variants… For a free service, that is something one can live with – especially since most users are likely interested in much shorter forecast timespans.
Here is some feedback on usability and suggestions for further development based on my experience gained during this race:
1. Setting the starting time of a trajectory happens in local time. We used UTC throughout also with other tools, and that is asking for mistakes (by the user). Also because we were busy around the clock and have produced countless trajectories. To avoid simple mistakes it would have proven useful to see or adjust trajectory starting time in UTC in the settings menu (given a completed trajectory, UTC times can be had by clicking on points of the curve).
2. The capability to simulate many trajectories (different altitudes, times, models, locations) and have them displayed in the same screen is a major advantage of the traj plugin. One can work out an optimal path pretty well (best takeoff time and location, altitude, change of altitude etc). Along the way you’d compute quite a few trajectories, most of which you’d throw away. Others you will like to keep. It’d be super useful to selectively discard trajectories without erasing them all. I have not discovered such a function.
3. Clicking on a point in a trajectory displays information on the computaion settings of the trajectory and the chosen point. This also selects the windy current time and location for a following trajectory calculation-very useful!
A suggestion: total trajectory duration is displayed in minutes (e.g. 2400 minutes in our case) other than in hours:minutes as selected in the Settings display. Display in hh:mm format would be more useful.4. When calculating three altitudes with three models, this will result in 9 trajectories displayed – this becomes confusing pretty quickly. Two suggestions:
4.a) trajectories of identical altitudes by different models have the same color. Marking trajectories additionaly by model would be very useful. Now, only when clicking the curve you see the underlying information.
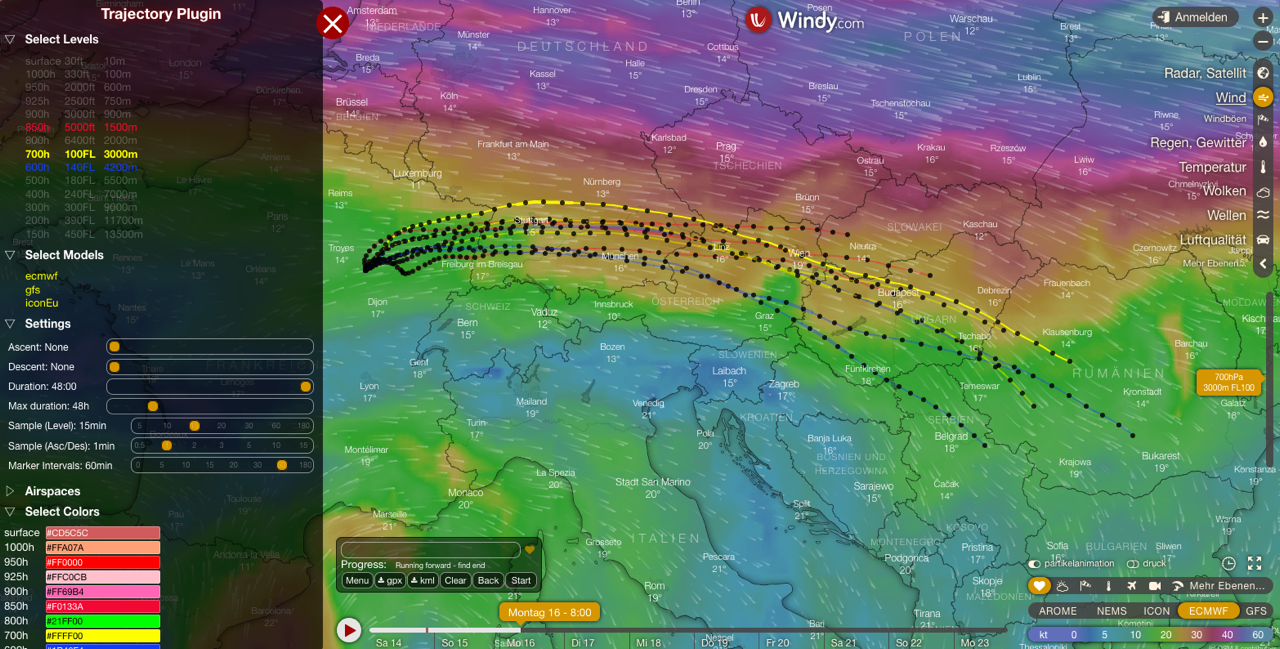
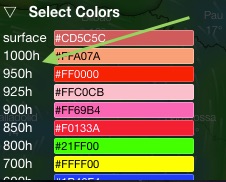
4.b) For better representation I chose higher-contrast colors than default. That is currently only possible by pressure altitude which is somewhat cumbersome. Adding altitudes in meters/feet would be a plus:
5. Not sure if it is possible to read out the last update time for a given model in windy with a plugin. But it would be super useful to display this to rate its relative value. One can find that information, but it takes several clicks and not in direct comparison of the trhee models. It would be great to see this for instance in the Settings menu where you select models.
Wrapping up: I certainly did not use all features of windy or the traj plugin for that matter, since I encountered this only recently (and through your blog, by the way). But then in the days before and during the race I guess I used it for 12 hours a day and I am very impressed by its potential!
ps: as I was writing this up, I tried to access the plugin. But it seems it is currently unavailable, as are other plugins. Never happened before!
Attached below find some recordings – I hope you find it useful!
best regards
Kolja