How would you distribute windy trajectories during weather briefings at balloon events? You did save the result as GPX file. And now what?
Paper: meh. Display screenshot on projector? confusing spaghetti. Post a KML or GPX file on a whatsapp group? hardly anybody could open such files on their mobiles and pads.
Pretty easy with GPSVisualizer:
upload the GPX file so it is Internet-accessible and note its URL (e.g. as a WordPress media file – here’s an example GPX file for you to play with)
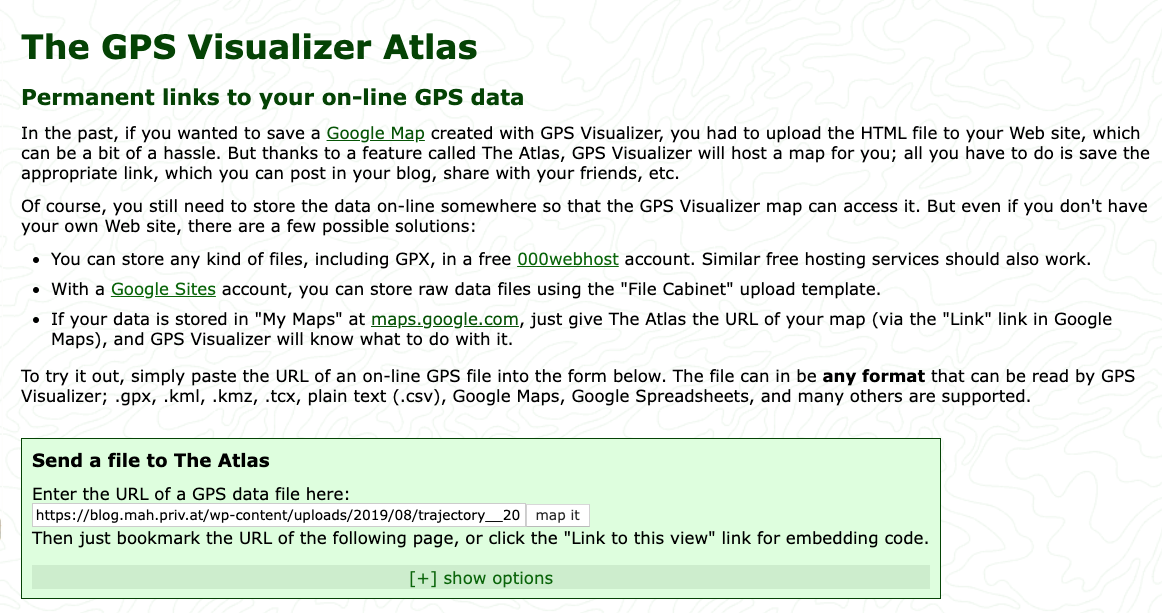
goto GPSVisualizer.com and paste the URL of the GPX file into the “Send a file to The Atlas” field:
GPSVisualizer Atlas page
hit the “map it” button – you should see something like this:
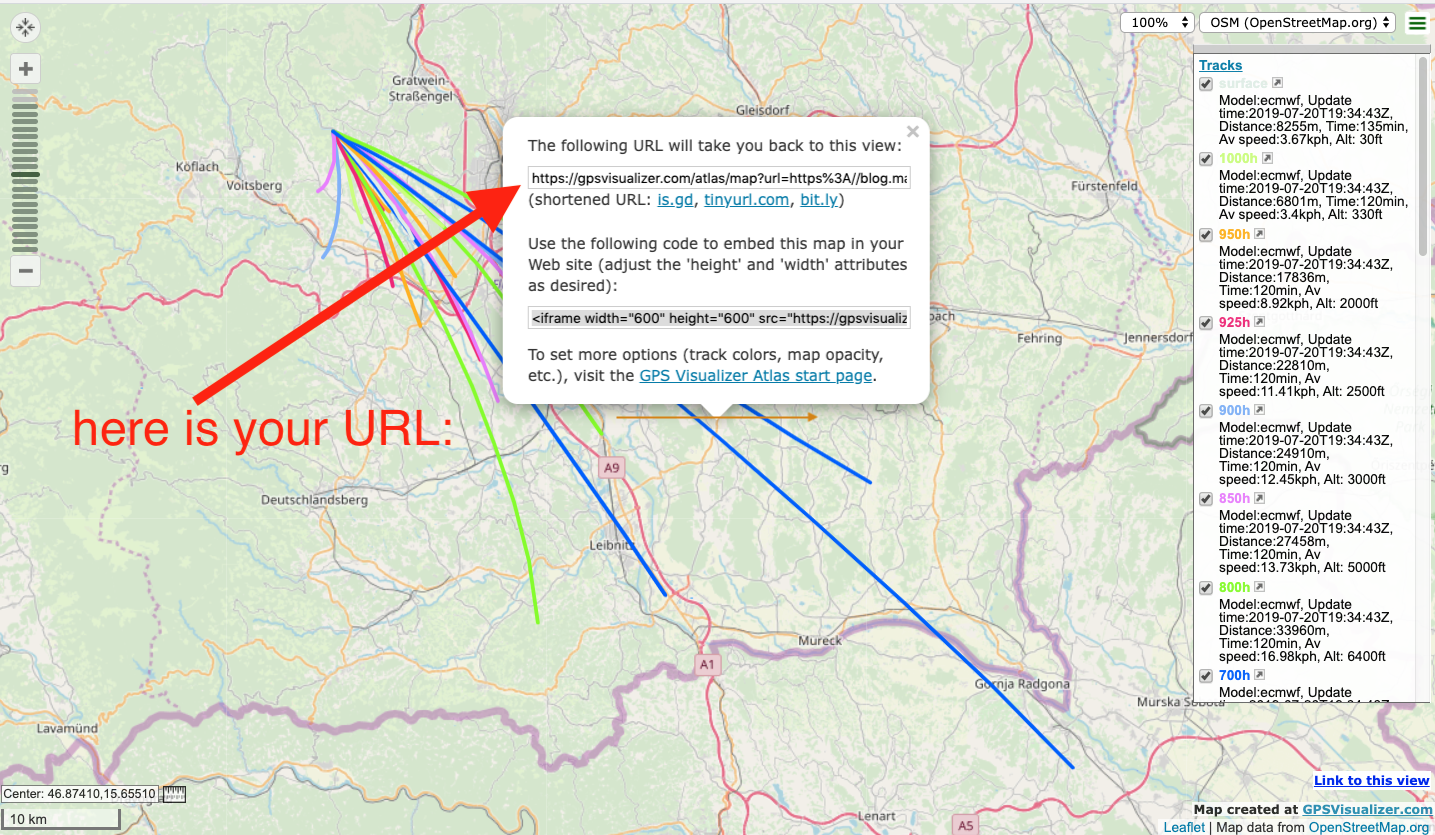
That’s thew view you’d want to distribute – people can pan and zoom around, and select/deselect heights and models in the trajectory set.
To create a URL for this view:
Click the blue “Link to this view” field at the right bottom:
Edit: There is currently a minor bug in the GPSvisualizer web service – uploaded tracks vanish after a certain time, and the message ‘File … contains no usable data’ is displayed.
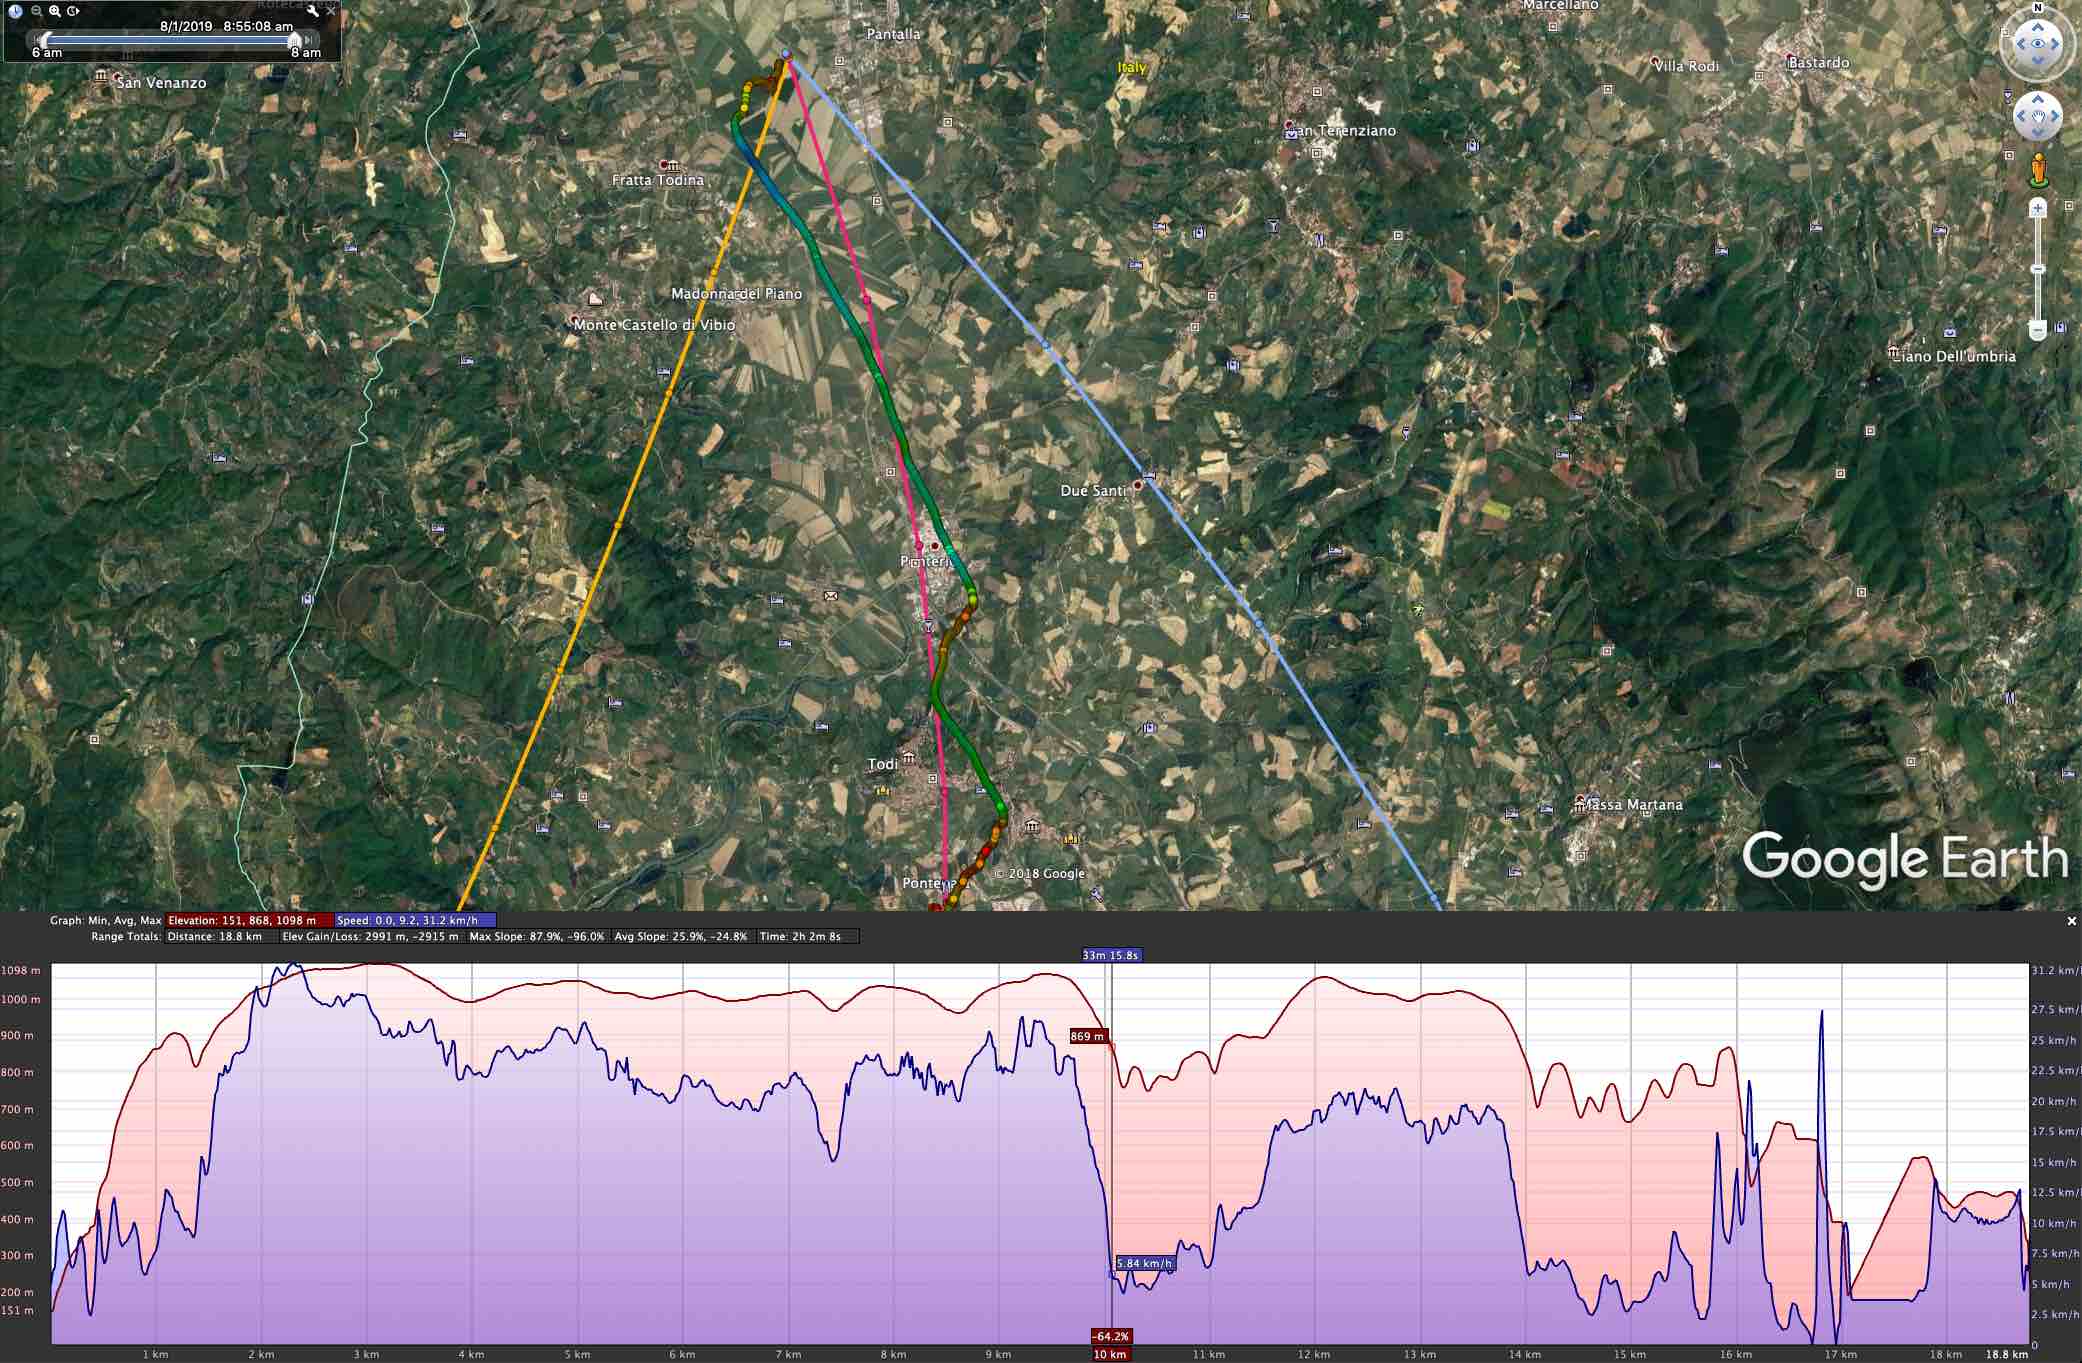
Most of the flight was between 800m and 1000m altitude, so I selected the 2000ft (amber), 2500ft (red) and 3000ft (blue) trajectories.
The ECMWF model had the best match, so only ECMWF forecasts are shown.
The flight started on the valley floor, within an inversion and a slight northerly flow.
The match is excellent – especially with the 2500ft trajectory, and the descent phases around 11km and 15km into the flight show the northeasterly flow forecast by the amber line.
As to be expected, the track is shorter than the forecast – slightly more than half the distance.
my gut feeling after comparing several forecasts to tracks: ECMWF wind speed forecasts are a tad on the high side.
I love doing winter long-distance flights. Since there is only very limited documentation on the do’s and dont’s, I wrote up a tutorial/talk on the issue:
windy.com is a phenomenal resource for weather forecasting. It’s less of a “will it rain at X by Y” type app but rather a data viewer for many different layers of information – you will have to draw your own conclusions. It also sports a variety of forecast models (among them the $$$ ECMWF) – for free. And it supports user-written plugins for specific purposes, which has unleashed a lot of creativity by weather-affine geeks.
For balloonists, the traj plugin is very useful – it can create tracks to answer the question “If I start at X and fly level in altitude Y at time Z, which track would I fly?”. And it can answer this according to several weather models – in Europe that’d be ECMWF, GFS and ICON-EU.
Here’s a short how-to for generating trajectories:
The traj plugin currently only works on desktop browsers – not (yet) on mobiles
The plugin must be explicitly loaded after pointing your browser to https://www.windy.com/ : click on the top left “Hamburger” (three horizontal bars) icon. In the dropdown, click “Install Windy plugin” and scroll down until you find the “Trajectory” plugin – then click on “Open”.
two windows will appear – one with explanations and one for parameters.
Select altitudes and duration in the parameter window.
Set a start time using the time selector at the bottom of the screen.
Select a model (ICON, ECMWF or GFS) in the right bottom model selector.
Choose a start location – either by clicking on the map window (the “picker”) or choosing a favorite by clicking the heart icon in the parameter window which will present a dropdown of your favorite locations
click “Start” – which changes the label on this button to “Stop”
the progress can be seen on-screen as the curves are drawn
the black bullets denote hourly intervals
Click on the lines, or the bullets for detail information (time, speed, model, model generation time etc)
when the plugin is done, you can download the trajectories as GPX files by clicking “Save”
Trajectory tutorial video (slightly out of date)
Advanced features include:
simulation of ascent and descent – if set to zero, just level flight will be simulated
backwards trajectories – those answer the question “If I want to go to location X, where do I need to start?”
duration of the trajectory: up to 240 hours – useful for gas balloon flights
Google Earth doc name: start, destination & day of flight
Colorize by: Speed
Altitude mode: Absolute (for flights)
Draw a shadow: 30% opacity – yields an actual track over ground
Tip: click Save these settings and next time all settings will be restored.
Gpsvisualizer.com parameter settings
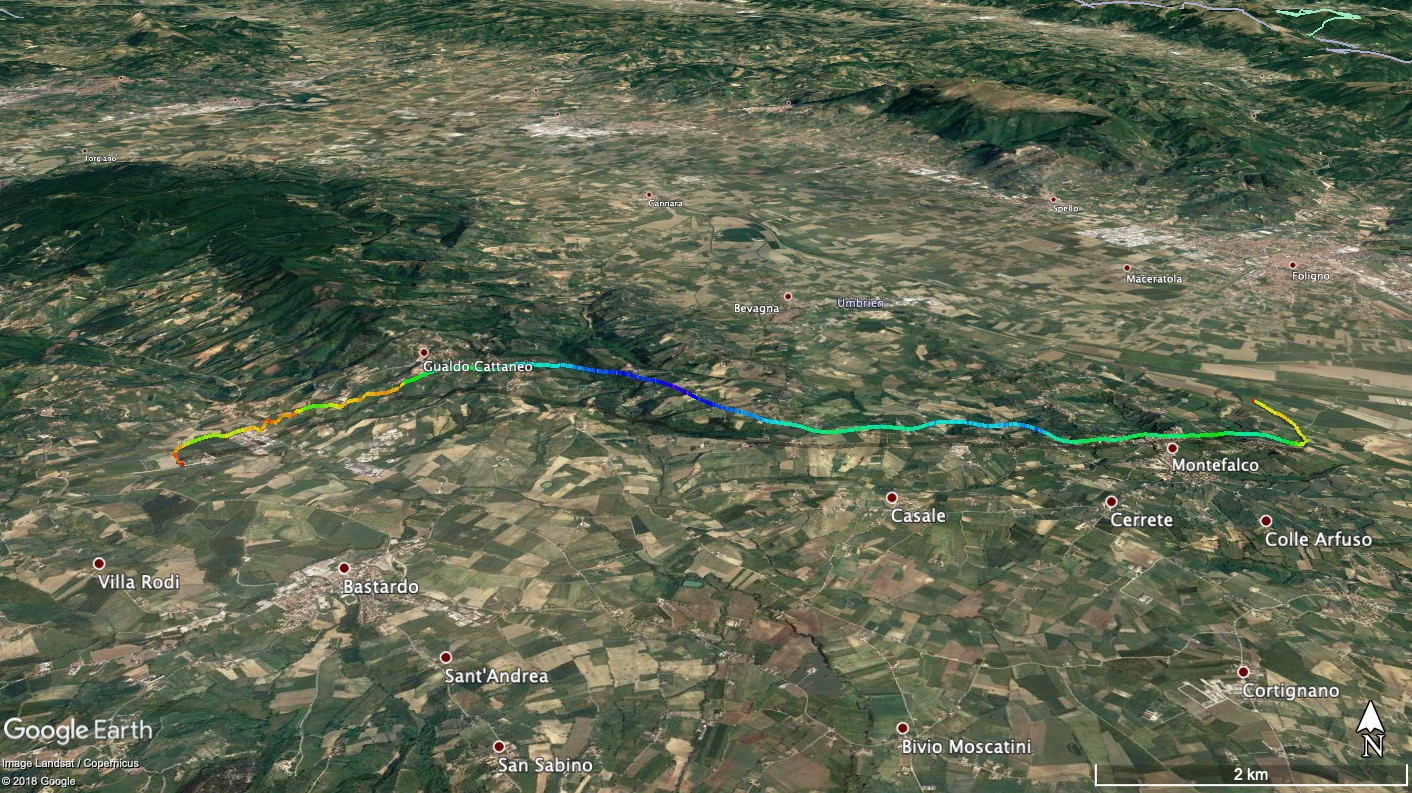
The result is a compressed KML file which looks like so when openend in Earth:
Update:
Many GPS sources create lots of trackpoints – so much that the resulting tracks look like a series of balls. Way too dense to be useful.
Also, the line segments generated by the settings above lack useful information (just text like ‘trkpt 660’). Adding waypoints in gpsvisualizer adds more detail.
Hour marks, as well as time stamps for takeoff and landing time are lacking above.
A good setting to deal with these issues is:
“Trackpoint distance threshold” : 20m
“Draw as waypoints”: Yes, named with timestamps
“Tickmark interval”: 1h
“Zero distance mark”: Yes (this field only appears when you enter a value into “Tickmark interval”)
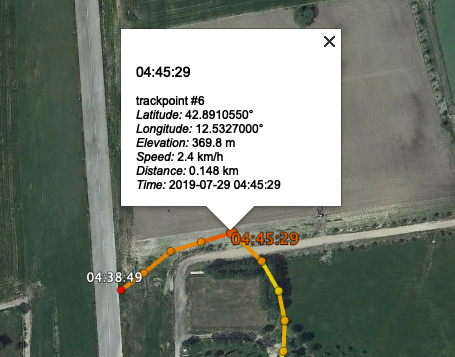
This gives us waypoints every 20m (good enough) and klicking them in GE reveals useful information:
Clicking a waypoint. Note timestamp on takeoff location
Google Earth can create flight simulations based on actual tracks. Here is an example animation which created this video, based on the flight track which was converted from GPX to KML like outlined here.