I’m always interested in comparing forecast trajectories versus tracks flown – I posted some data points here.
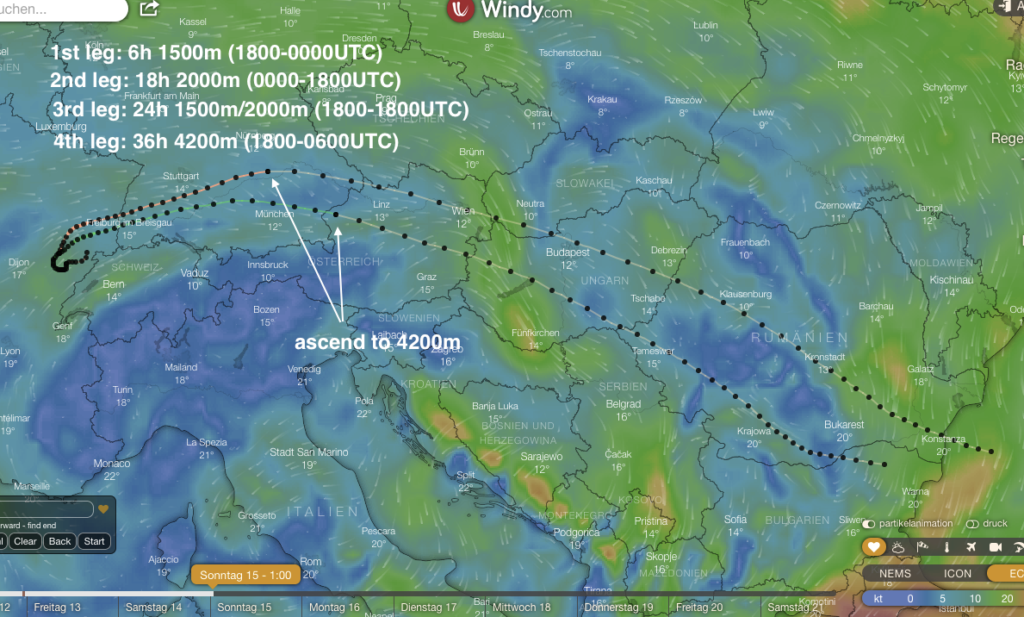
Thanks to Kolja Packard’s excellent field report (in german and english) we have a new one – the first image in Kolja’s report shows their trajectory forecast done 22 hours before takeoff, and looking out 80 hours. This was their forecast:
now compare that to the actual tracks flown as recorded on the Gordon Bennet Cup website:
Kolja Packard was member of the ground support team for the Belgian, Spanish and US teams at the Gordon-Bennet-Cup 2019 – the most prestigious gas ballon race in the world. He used – among other tools – windy.com and in particular traj – the trajectory plugin – to aid pilots with weather information and tactical advice.
Kolja writes:
Experiences with the Windy Trajectory Plugin
Hello Michael,
find below a summary of the experiences and impression of the trajectory plugin for windy.com. I used it in the – rather particular – setting of planning and supporting a long-distance (and long time!) race with gas balloons during this year’s Gordon Bennet race starting from Montbéliard.
Usually with gas balloon rides a duration of 6-12 hours is of interest. But in competitions, flights lasting several days are possible. With this year’s Gordon Bennet Race – which is about maximum-distance-flown, due to the overall weather situation, flight times of up to 72 hours and much more were possible.
For the average – and much more common – hot air balloon pilots flights of around 1-3 hours in the morning and in the evening are more typical.
We looked into possible tracks while supporting three teams (BEL1, ESP1 and USA1) and those were quite long-lasting flights. Our strategy – and therefore the search for relevant information – looked at 80 hours onward from the start even before takeoff!
By using windy’s traj plugin, we gained the following advantages:
1. trajectories based on additional weather models – only windy could provide data for ECMWF and IconEU beyond the GFS-based HYSPLIT and the GFS-derived NEMS model by Meteoblue
2. it was straightforward to model long duration trajectories with changing altitudes and represent those in a single screen view
ad 1) especially during diverging forecasts there is value in having data from different models at hand, so as to get at least a rough tendency of weather development
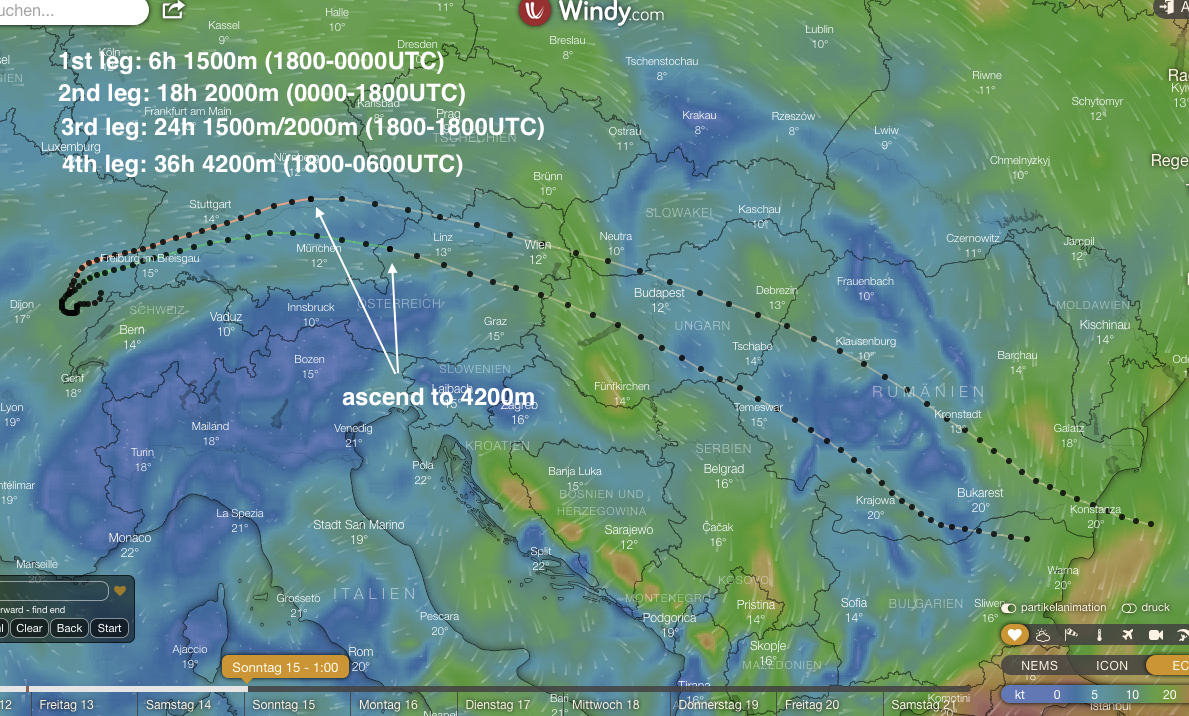
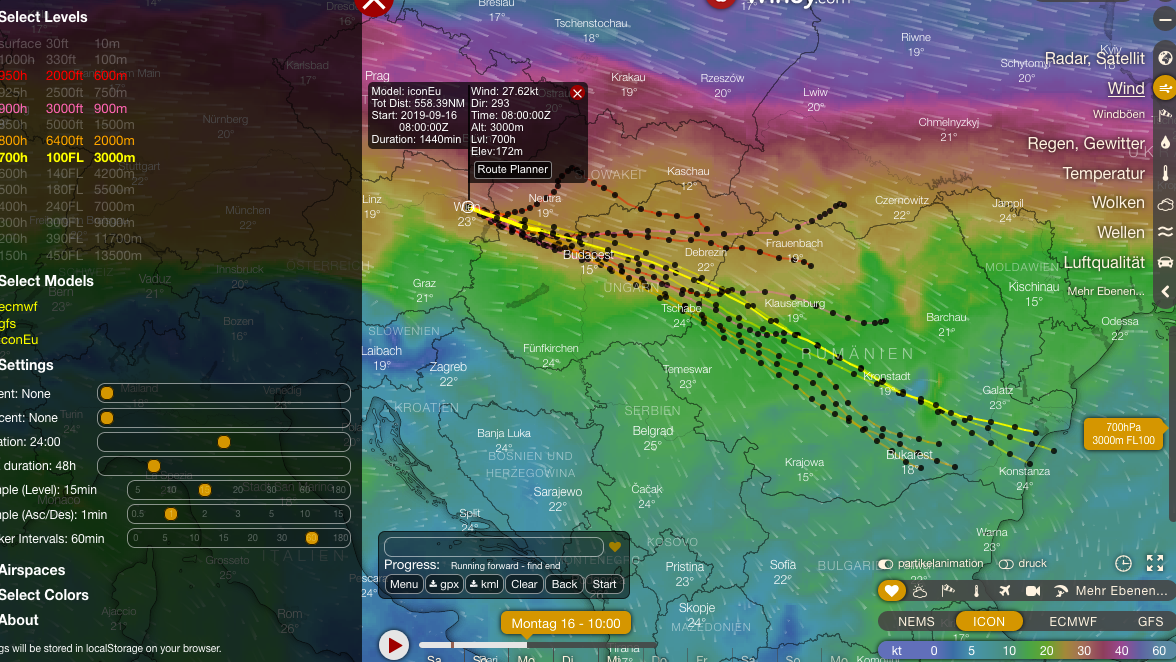
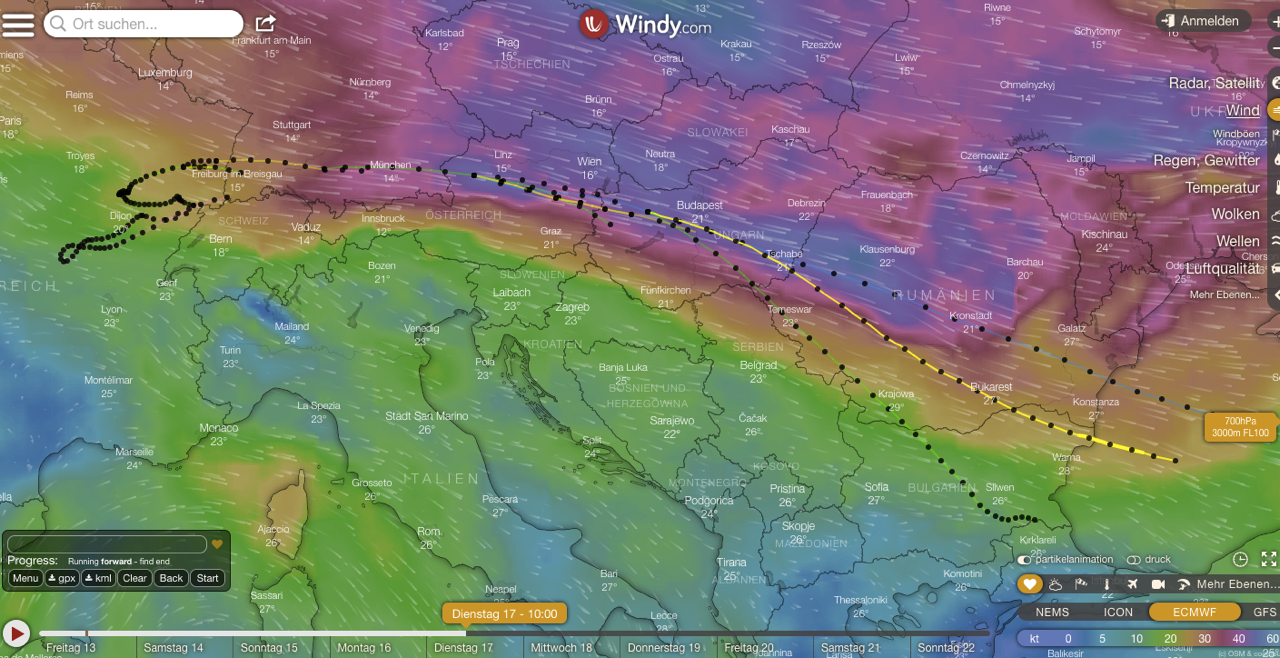
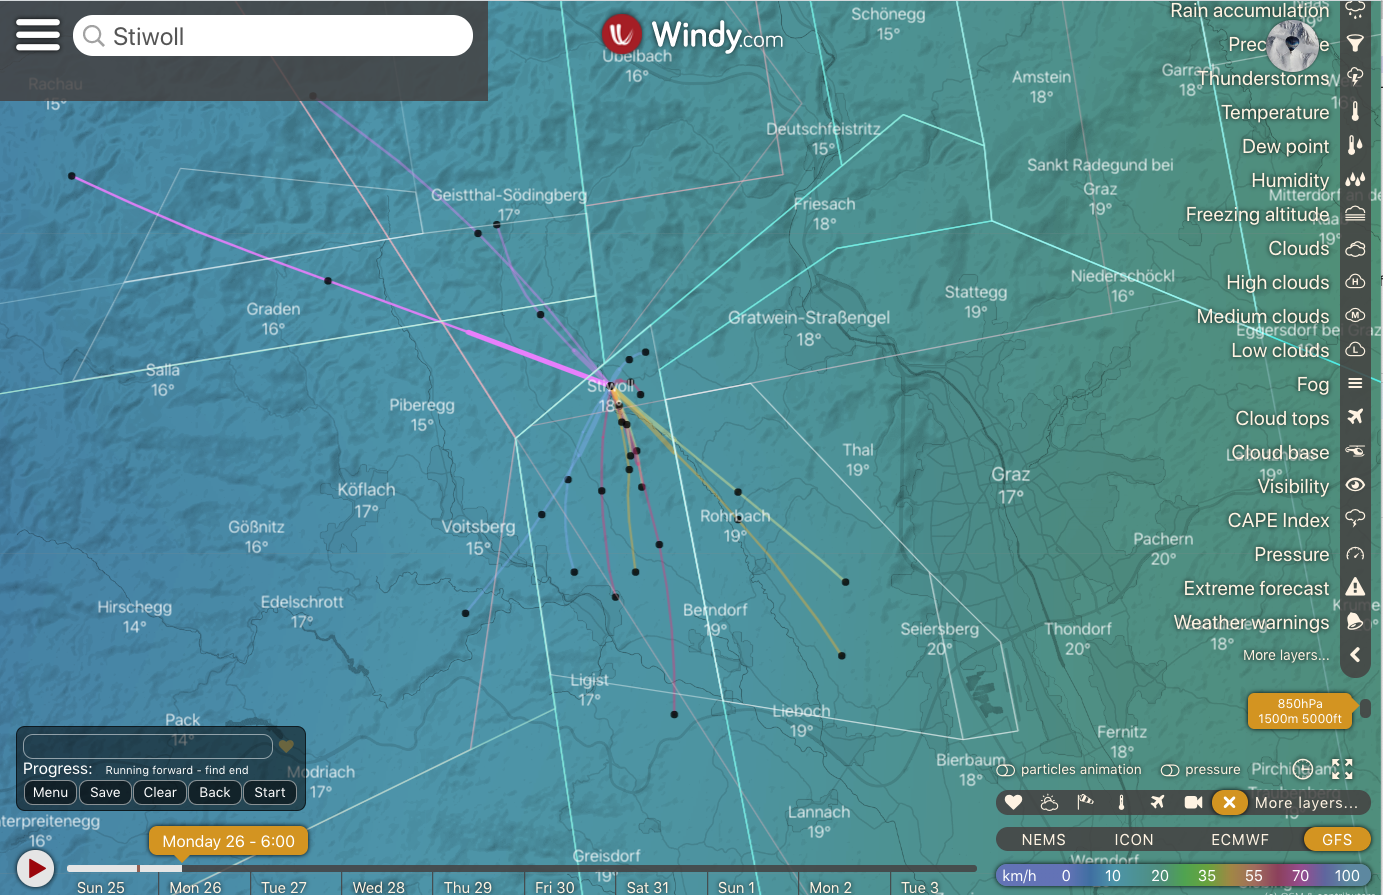
ad 2) example below: multilevel trajectory produced 22 hours before takeoff (actually this are 4 partial trajectories following each other with different altitudes assembled into a single view):
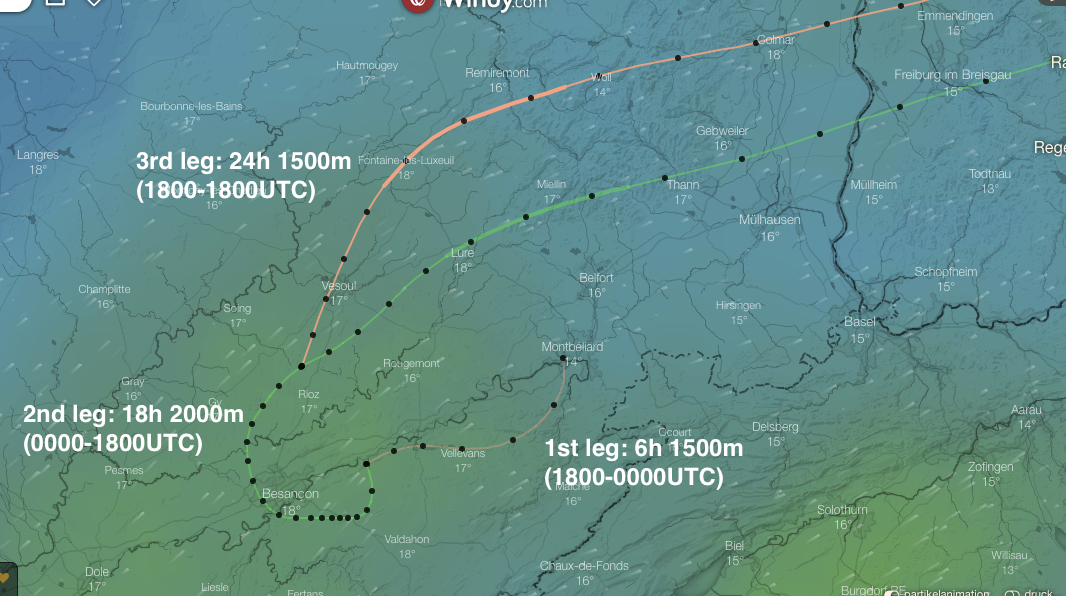
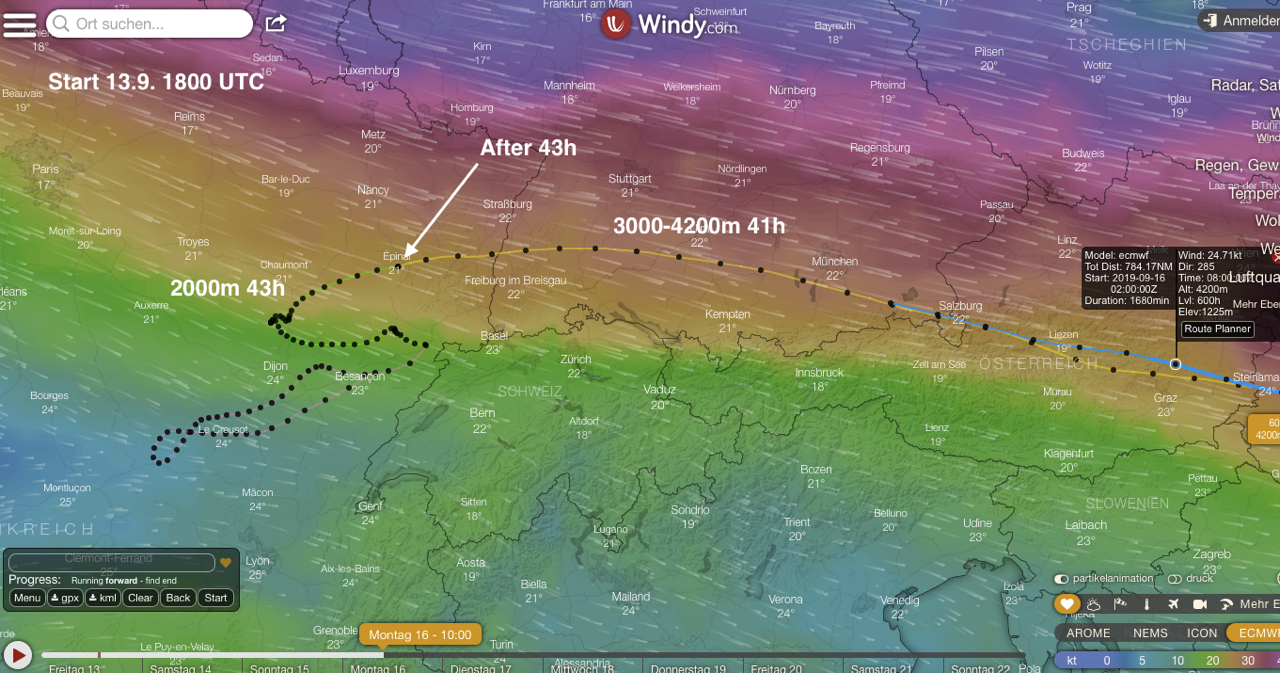
Detail view of how partial trajectories are assembled:
See below for details on tagging and coloring trajectories, for instance by model
For developing such a “multi-level trajectory”, you start with a single parameter set (height, model etc) and just start another trajectory at a certain point with a different set of parameters.
One can add aribtrary trajectories at arbitrary points of an underlying trajectory so as to estimate the impact of altitude changes at different points into the flight given a location, and develop a strategy based on the result.
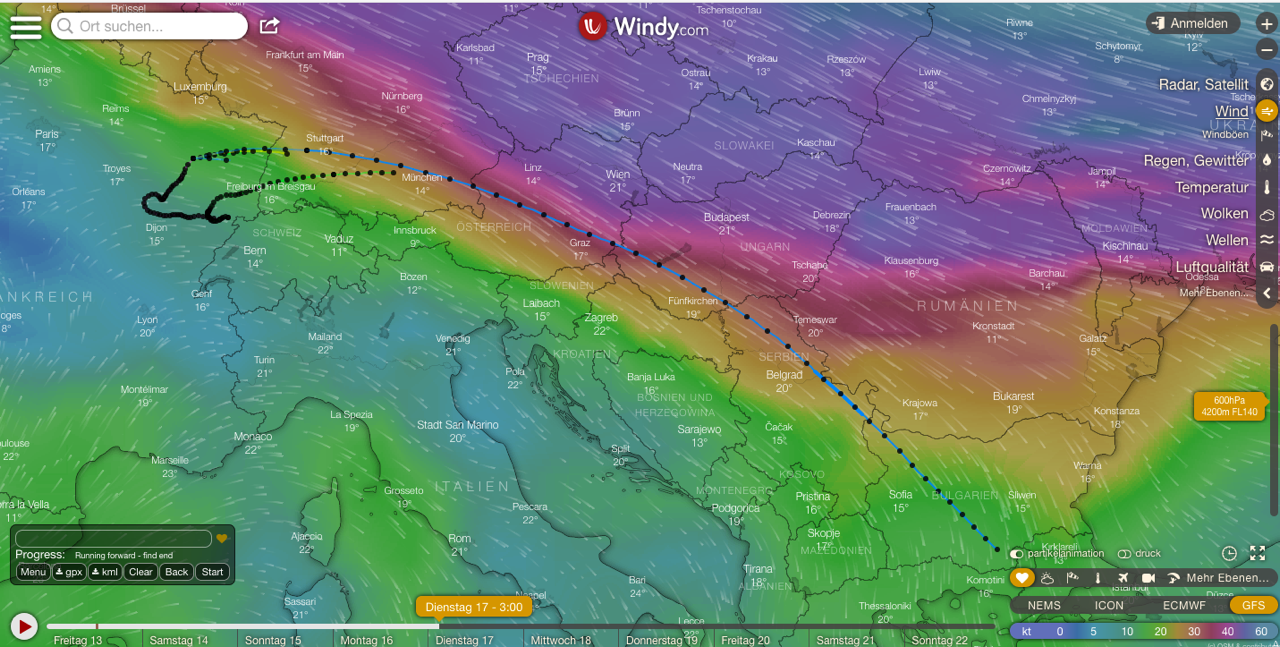
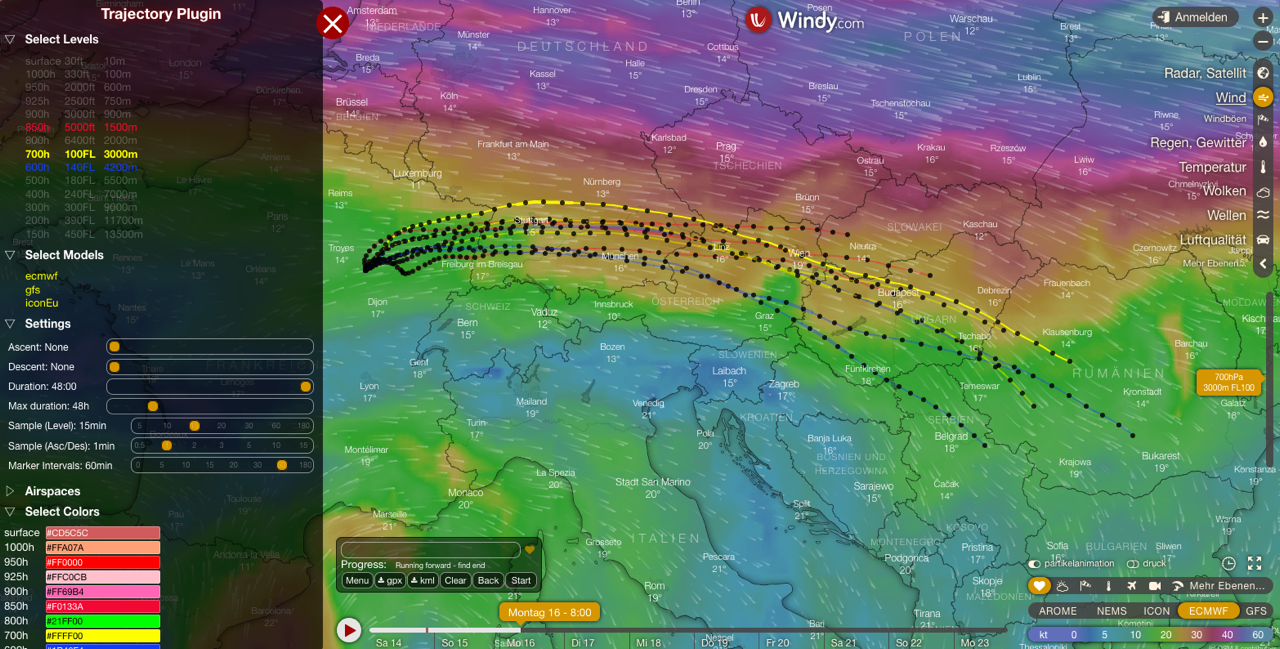
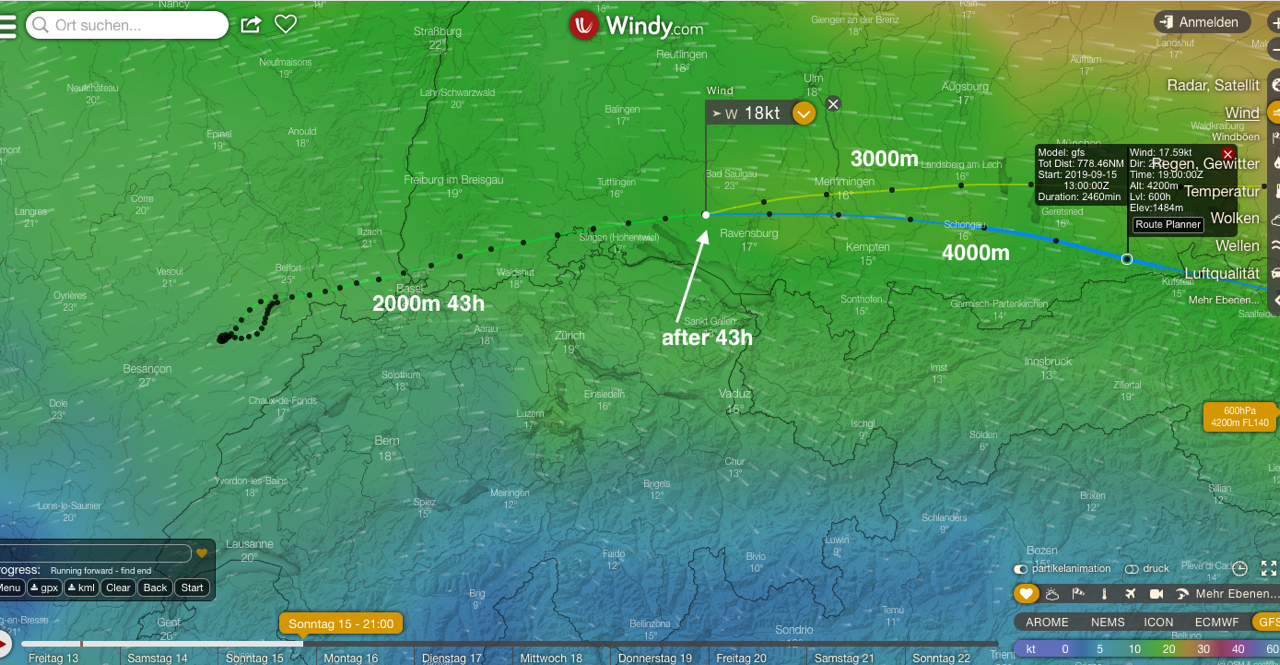
Using all available models, views become confusing quickly. Here we show a forecast based on a single model while varying the altitude. Takeoff locations and times are subject to pilot’s discretion – and mistakes. Three models displayed simulataneously.
I did not use the ascent/descent simulation provided by the traj plugin – trajectories at a given altitude for extended periods of time were more relevant to us.
Further into the race, we were faced with short-term decisions beyond the long-range planning. Here some features of the traj plugin proved useful.
For instance, for short-term forecasts the age of a forecast is relevant – it makes a difference if it is a new iteration or several hours old.
There was no clear “winner” in terms of models as for accuracy – generally the ECMWF model provides reasonable results, on short-term IconEU also got some best suiting forcasts to actual conditions.
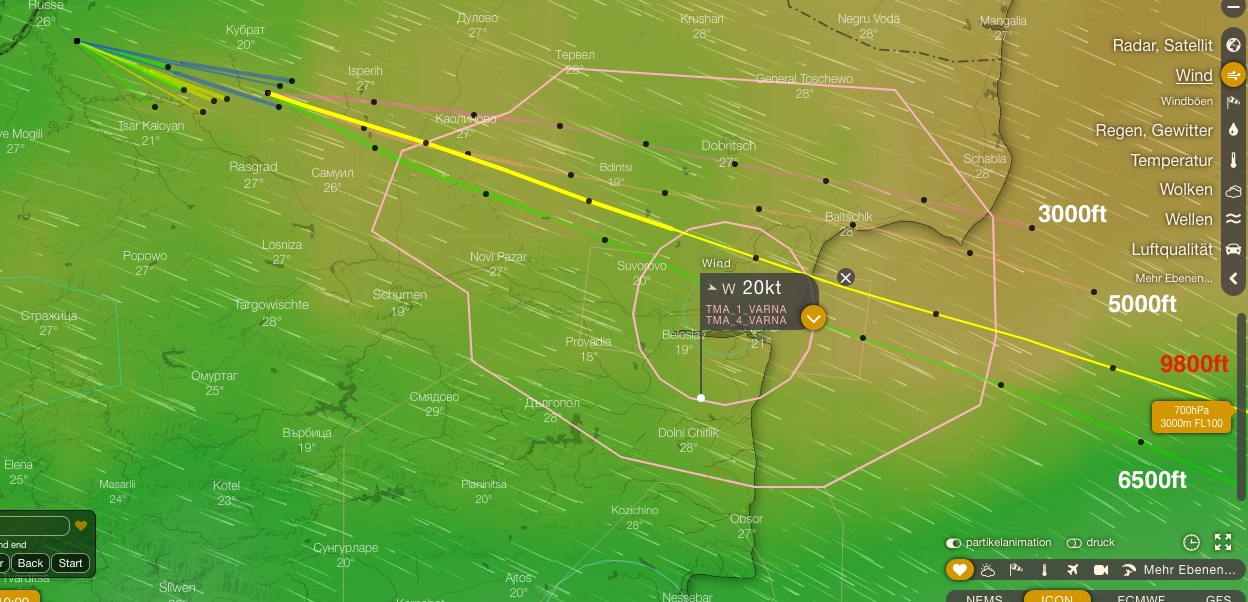
Adding airspace information to trajectory tracks is very helpful (even if available as a separate windy plugin).
Here the goal was to steer the BEL1 team around, or within the airspaces encountered, only at certain altitudes. The blue trajectories correspond to an hour of flight at current altitude, based on three models. Thereafter, a simulation at different altitudes based upon the – then – most current model.
The following features proved useful:
– the resulting trajectories can be overlaid with all data provided by windy. By clicking on a point in a trajectory, forecast time is automatically adjusted, as is the altitude. That makes it straightforward to estimate conditions at a certain point into the flight.
– map display in windy is very flexible, for instance scaling and import of non-standard geodata.
– exporting trajectory data from the plugin is very useful.
During intense use of traj, I’ve encountered some restrictions and issues, and I have some suggestions for further development.
I encountered two issues during 5 days of use – which I generally would rate as “explainable”:
1. Looking ahead over 40 hours, I ran into a problem with IconEU – forecasts got stuck some 3 days into the future – the site got stuck and required a restart in a new browser window.
This did not occur with other models, and also did not reoccur during later phases of the flight when we only looked at shorter time spans.
2. On and off the trajectory computation appears delayed as – according to a message on-screen – there was no connection to the server. Certainly this is attributable to our makeshift Internet hookup for our “Control Center”. Nice to see that the job did not fail but rather eventually continue once network connectivity was reestablished. And this is only was an issue because it took quite some time to compute the trajectories – more below.
The only real downside to the traj plugin – and then only compared to some commercial alternatives and when computing long-lasting flights, and therefore not neccessarily felt by many users is its low speed of computation.
In particular, when using multiple models over an extended period of time, the job might take 10 minutes or more. But if I understand it right, the traj plugin just queries wind info on the current location and time from windy and trajectory computation happens locally, not on the server.
Given 3 models, maybe 3-4 altitude levels and – for example -40 hours lookahead, that’s 480 data snapshots taken by the client, and that takes its time. And I had to forecast 80 hours in different variants… For a free service, that is something one can live with – especially since most users are likely interested in much shorter forecast timespans.
Here is some feedback on usability and suggestions for further development based on my experience gained during this race:
1. Setting the starting time of a trajectory happens in local time. We used UTC throughout also with other tools, and that is asking for mistakes (by the user). Also because we were busy around the clock and have produced countless trajectories. To avoid simple mistakes it would have proven useful to see or adjust trajectory starting time in UTC in the settings menu (given a completed trajectory, UTC times can be had by clicking on points of the curve).
2. The capability to simulate many trajectories (different altitudes, times, models, locations) and have them displayed in the same screen is a major advantage of the traj plugin. One can work out an optimal path pretty well (best takeoff time and location, altitude, change of altitude etc). Along the way you’d compute quite a few trajectories, most of which you’d throw away. Others you will like to keep. It’d be super useful to selectively discard trajectories without erasing them all. I have not discovered such a function.
3. Clicking on a point in a trajectory displays information on the computaion settings of the trajectory and the chosen point. This also selects the windy current time and location for a following trajectory calculation-very useful!
A suggestion: total trajectory duration is displayed in minutes (e.g. 2400 minutes in our case) other than in hours:minutes as selected in the Settings display. Display in hh:mm format would be more useful.
4. When calculating three altitudes with three models, this will result in 9 trajectories displayed – this becomes confusing pretty quickly. Two suggestions:
4.a) trajectories of identical altitudes by different models have the same color. Marking trajectories additionaly by model would be very useful. Now, only when clicking the curve you see the underlying information.
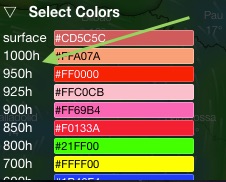
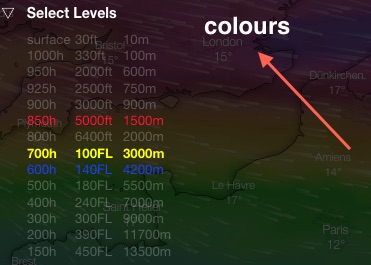
4.b) For better representation I chose higher-contrast colors than default. That is currently only possible by pressure altitude which is somewhat cumbersome. Adding altitudes in meters/feet would be a plus:
5. Not sure if it is possible to read out the last update time for a given model in windy with a plugin. But it would be super useful to display this to rate its relative value. One can find that information, but it takes several clicks and not in direct comparison of the trhee models. It would be great to see this for instance in the Settings menu where you select models.
Wrapping up: I certainly did not use all features of windy or the traj plugin for that matter, since I encountered this only recently (and through your blog, by the way). But then in the days before and during the race I guess I used it for 12 hours a day and I am very impressed by its potential!
ps: as I was writing this up, I tried to access the plugin. But it seems it is currently unavailable, as are other plugins. Never happened before!
Attached below find some recordings – I hope you find it useful!
Kolja Packard war im Rahmen des Gordon-Bennet-Cup 2019 beim Bodenteam für Mannschaften aus Belgien, Spanien und USA. Er hat windy.com – und insbesonders traj, das Trajectory-Plugin – verwendet, um die Piloten taktisch zu unterstützen. Kolja schreibt mir:
Eindrücke zum TrajektorienPlugin für Windy
Hallo Michael,
im Folgenden findest du eine Zusammenfassung über meine Erfahrungen und Eindrücke zum Trajektorien-Plugin für Windy.com, die ich im ganz speziellen Anwendungsfall für die Planung und Betreuung von Langzeit- bzw. Distanzfahrten von Gasballonen im Rahmen des diesjährigen Gordon Bennett Rennens in Montbéliard machen konnte.
Für eine gewöhnliche Gasballonfahrt sind Fahrtzeiten von 6 – 12 Stunden von Interesse. Im speziellen Falle von Leistungs- oder Wettbewerbsfahren sind auch Fahrtzeiten von mehreren Tagen möglich. Im ganz speziellen Falle des diesjährigen Gordon Bennett Rennens (eigentlich ja über die maximale Distanz, was aber natürlich auch eine lange Fahrzeit impliziert) kam es bedingt durch die Wetterlage zu Fahrten von deutlich über 72 Stunden, sogar bis zu 90 Stunden.
Ich gehe davon aus, dass bei der zahlenmäßig weit stärker vertretenen Fraktion der Heißluftballöner eher kurze Fahrten im Bereich 1-3 Stunden in einem definierten Zeitfenster in der Früh oder am Abend interessant sind.
Die möglichen Fahrtverläufe, die uns bei der Unterstützung dreier Teams (BEL1, ESP1 und USA1) bei diesem Rennen interessierten, waren also von beträchtlicher Dauer und unsere Strategie und somit die gesuchten Informationen beliefen sich schon vor dem Start auf über 80 Stunden!
Bei diesen zeitlich weiträumigen Strategieentwicklungen vor dem Start waren bereits zwei deutliche Informations- Hinzugewinne durch das Plugin ersichtlich:
1. Trajektorien basierend auf zusätzliche Wettermodellen möglich (NEMS mit Meteoblue, GFS mit windy+plugin und HYSPLIT und zusätzlich ECMWF und IconEU ausschließlich mit windy+plugin)
2. Strategien mit wechselnden Fahrthöhen waren ohne größeren Aufwand zu berechnen und auch direkt zusammen darstellbar
Zu 1.: Wie auch sonst, wenn man bei nicht eindeutigen Vorhersagelagen gerne mehrere Modelle zu Rate zieht, um zumindest über die grobe Tendenz einer Entwicklung eine zuverlässigere Auskunft zu erhalten, war es auch bei der Trajektorienberechnung ein Gewinn weitere Wettermodelle zu Rate ziehen zu können.
Zu 2.: Hier ein Beispiel zu Multilevel-Trajektorie etwa 22 Stunden vor dem Start gerechnet (eigentlich 4 Teiltrajektorien mit unterschiedlichen Höhen direkt aneinander gefügt):
Das Aneinanderfügen von Trajektorien im Detail:
(Zur Farbgebung und Kennzeichnung der Trajekorien, z.B. nach zu Grunde liegendem Modell, Weiteres unten)
Beim Rechnen solcher “Multilevel-Strategien” bzw. “Multilevel-Trajektoerien” rechnet man einfach eine Trajektorie und fügt danach eine weitere mit abweichenden Parametern an usw.
Dabei ist es sehr nützlich an einer vorhandenen Trajektorie eine Vielzahl neuer Trajektorien ansetzen zu können, und zwar nicht nur am Ende sondern an jedem beliebigen Punkt, und somit die Auswirkung von möglichen Höhenänderungen zu jedem Zeitpunkt der Fahrt (am vorausberechneten Ort) abschätzen und somit eine mögliche Strategie entwickeln zu können.
(Berechnet man alle drei Modelle, wird es schnell unübersichtlich. Hier nur ein Modell genutzt mit verschiedenen Höhen. Farben kontrastreicher gewählt. Ausgangspunkte und dazugehörige Startzeiten von Trajektorien sind ausschließlich in der Kontrolle und somit auch Fehleranfälligkeit des Benutzers.)
(drei Modelle parallel berechnet)
Da es für unsere Vorausberechnungen von vielen Stunden nicht relevant war, habe ich die Funktion des Steigens/Fallens, die das Plugin ja schon mitbringt, nicht verwendet. Uns interessierte was in einer bestimmten Höhe über längere Zeit zu erwarten war.
Je weiter wir in das Rennen kamen und sich somit parallel zur längerfristigen Vorausplanen auch kurzfristige Fragestellungen ergaben, desto mehr zeigten sich noch weitere Funktionen des Plugins als nützlich. Für kurzfristige Vorhersagen kann es z.B. eine Rolle spielen, ob ein Wettermodell auf dessen Basis eine Trajektorie berechnet wird, schon viele Stunden alt ist oder eben kürzlich neu zur Verfügung gestellt wurde. Die Genauigkeit der Vorhersagen der verschiedenen Modelle war im Übrigen nicht eindeutig bei einem Modell größer. Tendentiell erschienen die Trajektorien mit dem ECMWF-Modell eine gute Vorhersage zu erzielen. Im Kurzfristigen Bereich war bei größerer Aktualität das IconEU Modells auch mal näher an den eintretenden Verhältnissen gelegen.
Im Verlauf der Langfahrt war das Einblenden der Lufträume (im Plugin integriert, sonst auch über separates Plugin möglich) eine große Hilfe.
(Ziel: BEL1 am Luftraum vorbei, bzw. im Luftraum nur mit bestimmten Höhen, zu dirigieren. Die blauen Trajektorien entsprachen einer Stunde vom Berechnungszeitpunkt in der aktuellen Fahrthöhe gerechnet mit drei Modellen. Als Kontrolle dazu andere Höhen. Danach mögliche Optionen mit dem zu dem Zeitpunkt aktuellsten Wettermodell.)
Folgende weitere Punkte sind positiv aufgefallen: – Die Trajektorien können auf Windy mit allen von Windy zur Verfügung gestellten Daten überlagert dargestellt werden. Durch klicken auf einen Punkt der Trajektorie springt die Darstellung automatisch zu dem entsprechenden Zeitpunkt und, z.B. bei der Darstellung des Windes, auch in die entsprechende Höhe. So ist sehr gut abzuschätzen, welche Verhältnisse zu welchem Zeitpunkt der Fahrt herrschen. – Die Handhabung der Kartendarstellung ist in Windy sehr komfortabel. Skalierbarkeit, Import anderer Geodaten,… – Das Exportieren der Trajektorien direkt aus dem Plugin ist ebenfalls ein plus.
Natürlich habe ich durch die intensive Nutzung auch die ein oder andere Einschränkung oder ein Problem erfahren und kann mir daher auch ganz konkrete Weiterentwicklungsmöglichkeiten vorstellen.
Zwei Probleme sind im Laufe der 5 Tage aufgetreten, die ich aber beide als “erklärbar” einstufe. 1. Bei einer Berechnung von über 40 Stunden hatte ich einmal das Problem mit dem Modell IconEU, dass eine Trajektorienberechnung immer am selben Zeitpunkt (etwa 3 Tage in der Zukunft) hängen blieb und die Seite dadurch nicht mehr reagierte und ein neues Browserfenster gestartet werden musste. Mit den anderen Modellen tauchte das Problem nicht auf. Es ist ebenfalls zu einem späteren Zeitpunkt nicht mehr aufgetaucht, als nur noch kürzere Zeitspannen gerechnet wurden. 2. Das ein oder andere Mal war die Trajektorienberechnung verzögert, da, laut windy-Bildschirmmeldung, keine Verbindung zum Server bestand. Dies ist aber mit Sicherheit dem Internetanschluss in unserem provisorischen “ControlCenter” geschuldet gewesen. Positiv war hier, dass das Plugin dadurch nicht in einen Fehler lief sondern die Berechnung dann weiterführte, wenn die Verbindung wieder möglich war. Zu diesem Effekt kam es aber natürlich auch erst dadurch, dass das Berechnen der Trajektorien verhältnismäßig lang dauerte. Näheres dazu im Folgenden.
Der einzige für den Nutzer negative Punkt in der Nutzung des Plugins – und dies aber auch nur im Vergleich zu anderen teils kostenpflichtigen Angeboten und speziell bei Berechnungen von Trajektorien sehr langer Zeitdauer – ist die verhältnismäßig langsame Berechnung der Trajektorien. Zur Berechnung von Trajektorien, vor allem mit mehreren Modellen gleichzeitig, um auch den Vergleich zu haben, und über eine längere Zeitdauer, benötigt man dann schon mal 10 Minuten und mehr. Dies aber ebenso nachvollziehbar, da ich annehme, dass das Plugin einfach die jeweiligen Vorhersagezustände abruft, um die Trajektorie zu errechnen und die Berechnung ja nicht auf dem Server geschieht. Bei 3 Modellen, mit 3-4 Höhenleveln und z.B. 40 Stunden Dauer sind das dann ganz schnell mal 480 Istaufnahmen, die in Windy aufgerufen werden! Dies kommt natürlich vor allem beim Rechnen von langen Zeitdauern zum tragen. Und für die ganze Strategie musste ich 80 Stunden mit verschiedensten Varianten berechnen… Für ein Gratistool aber immer noch ein verschmerzbarer Nachteil, der für die meisten Nutzer, die viel kürzerer Trajektorien interessieren dürfte, nicht so erheblich sein wird.
Im folgenden noch ein paar Feedbackpunkte über Fehleranfälligkeit (in der Benutzung) und Anregungen zu möglichen Weiterentwicklungen auf Grund der erfahrenen Einschränkungen: 1. Das Einstellen der Startzeit einer Trajektorie geschieht durch den Zeitregler in Windy. Diese Zeit ist “local”. Da wir generell und auch mit anderen Tools mit UTC gearbeitet haben, gab es hier immer potential sich zu vertun. Wir waren natürlich rund um die Uhr damit beschäftigt und haben unzählige Trajektorien gerechnet. Zum vermeiden einfacher Fehler wäre es aber nützlich gewesen, wenn die Startzeit der Trajektorie in UTC zumindest im Settings-Menü ersichtlich oder sogar einstellbar wäre. (Bei der fertigen Trajektorie lässt sich der Zeitpunkt dann einfach in UTC ablesen durch anklicken der Trajektorie). 2. Der Vorteil dieses Plugins liegt vor allem darin, dass man viele Trajektorien (unterschiedliche Höhen, Modelle, Startzeiten, Startorte) nacheinander berechnen und in der gleichen Oberfläche anzeigen lassen kann. So kann man ein gewünschtes Ergebnis sehr gut herausarbeiten (bester Startzeitpunkt oder -ort, Fahrthöhe, Fahrthöhenwechsel…). Auf dem Weg dahin berechnet man in der Regel einiges an Trajektorien, die man gerne wieder verwerfen möchte, andere wiederum unbedingt behalten. Den größten Zusatznutzen hätte ich darin empfunden, wenn man einzelne Trajektorien wieder löschen könnte ohne alles zu löschen. Eine solche Funkion habe ich zumindest nicht gefunden. 3. Wählt man einen Punkt auf einer Trajektorie aus, bekommt man Informationen zur Berechnung der Trajektorie und Zeitpunkt des Punktes angezeigt. Außerdem kann man den gewählten Punkt auf der Trajektorie direkt als Ausgangspunkt für weitere Berechnungen nutzen. Sehr nützlich! Kleine Verbesserung der Nutzbarkeit: Die Gesamtdauer der Trajektorie wird hier in Minuten angezeigt, also z.B. 2400 Minuten, statt in Stunden:Minuten, wie man sie vorher auch in “Settings” ausgewählt hat. Die Darstellung in hh:mm wäre praktischer. 4. Berechnet man z.B. drei verschiedene Höhen mit allen drei Modellen erhält man 9 Trajektorien. Da wird es schnell unübersichtlich. Hierzu zwei Anregungen: 4.a) Da die Trajektorien einer gleichen Höhe verschiedener Modelle immer die gleiche Farbe haben wäre eine zusätzliche Kenntlichmachung der Trajektorie nach zu Grunde liegendem Modell nützlich. (Wird die Trajektorie angeklickt, erhält man die Information dieser einen Trajektorie. Das ist aber wenig praktikabel.)
4.b) Zur besseren Unterscheidung der verschiedenen Höhen habe ich jeweils kontrastreichere Farben als die Vorauswahl gewählt. Dies ist nur nach Druckhöhen im Bereich “settings->colours” möglich, was es etwas umständlich gemacht hat. Nach Höhen in Metern wäre ebenfalls wünschenswert. Evtl. wäre direkt bei der Auswahl der “levels” die Farbauswahl praktisch.
5. Ich weiß nicht, ob es einen Weg gibt die letzte Aktualisierung eines Wettermodells aus Windy herauszulesen und mit einem Plugin anzuzeigen. Das Wissen um den letzten Aktualisierungsstand ist zumindest sehr hilfreich um den Wert eines genutzten Modells im Vergleich zu einem anderen genauer einzuschätzen. In Windy lässt sich die Info herausfinden, nur eben mit mehreren Klicks verbunden und nicht in direkter Gegenüberstellung. Eine solche Info z.B. dort, wo man die Modelle auswählt in “Settings” wäre grandios.
Abschließend sei zu bemerken, dass ich bei Weitem nicht alle Möglichkeiten von Windy und in dem Zusammenhang auch von dem Plugin einsetzen konnte, weil ich erst sehr kurz vor dem Rennen mit dem Trajektorienplugin (übrigens über deinen Blog) in Berührung gekommen bin. In den Tagen vor und während dem Rennen habe ich mich aber wohl geschätzte 12 Stunden am Tag damit auseinander gesetzt und bin von dem Potential mehr als beeindruckt!
P.S.: Übrigens, als ich diese Zeilen schrieb wollte ich noch mal auf das Plugin zugreifen. Es war bei Windy aber nicht mehr möglich ein Plugin auszuwählen. Dies kam aber bisher noch nie vor.
Im Anhang noch ein paar “Aufzeichnungen” etc. falls von Nutzen.
Chris, the author of the traj plugin, has released a new version (0.5.1) with new functions – it is easier to use and more powerful! Also, a few days ago, windy updated the web version of their product and made it much simpler to work with plugins. So let’s have a look:
When you now click on the “Hamburger menu” (three horizontal bars, left top) and then “Install Windy plugin”, you see a gallery of approved plugins with an example screenshot, description with a link to more detail – scroll down to “Trajectory”, click “Open” and you are done!
Starting plugins in windy has become much easier
The traj plugin is now structured into a large parameter pane on the left, and a small operations menu center bottom – first, set all your params in the left pane, then run the operation from the operations menu.
Any parameters you set will be recorded and come up as before when you run windy.com again.
Example: parameters for a typical 2-hour summer season balloon ride
“Select levels” – select all from 100m to 1500m
“Select models” – ecmwf, gfs, iconEu (all are done in one go now – no more clicking “Start”, wait, change forecaste model, iterate!)
“Airspaces” – optional. Expand the menu; in my case, I click “Austria”; in case your screen gets overly cluttered, you can remove that airspace by clicking the small white-cross-on-red button besides the country name.
Thereafter, you do not need the parameter pane any more- click it away with the white-cross-on-red button on the top to get more screen space.
Next, select a start time by shifting the time selector at the bottom to your desired start time.
Finally, select a location. I use favourites – click on the heart icon in the operations menu, and select a location. Click the heart icon again to close the location dropdown. This will set the “location picker” – if there’s a message on screen saying “Place Picker”, repeat that process – it’s very easy to accidentally deselect the location picker.
Good to go! Click “Start” in the operations menu. That button changes to “Stop” while the process is running, and changes back to “Start” when done – wait for it. You will wind up with a screen roughly looking like so:
Trajectory generation finished
The black bullets along a track correspond to the “Marker intervals” setting in the parameter pane – I leave those as default, 1 hour.
Interpreting the results
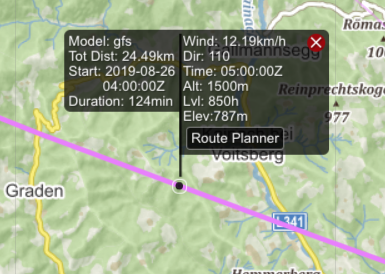
Click on a track – a two-part panel will pop up telling you more detail about this particular track at this point:
Forecast detail when clicking on a track
The left panel states the forecast model, and the time when the model was last updated.
The right panel shows wind speed, wind direction, time, altitude and ground elevation – so at the point we’d be roughly 700m above ground.
Note the “Route Planner” button – we’ll cover that in the next section (this function only works with tracks generated by the ECMWF model).
Usually tracks vary substantially at low levels, whereas in the free atmosphere tracks tend to converge quite closely. That degree of divergence between models for a given altitude also gives you a hint as to the likelihood of an actual flight matching the forecast. Several models agree: likely that is where you’re actually going.
I tend to believe the ECMWF forecasts most, with ICONEU a close second. But that is gut feeling and not science.
If you want to save those forecasts, click “Save” in the operations menu. The resulting file will be in GPX format and can be published for other people to see like so.
Drilling down: displaying a cross section
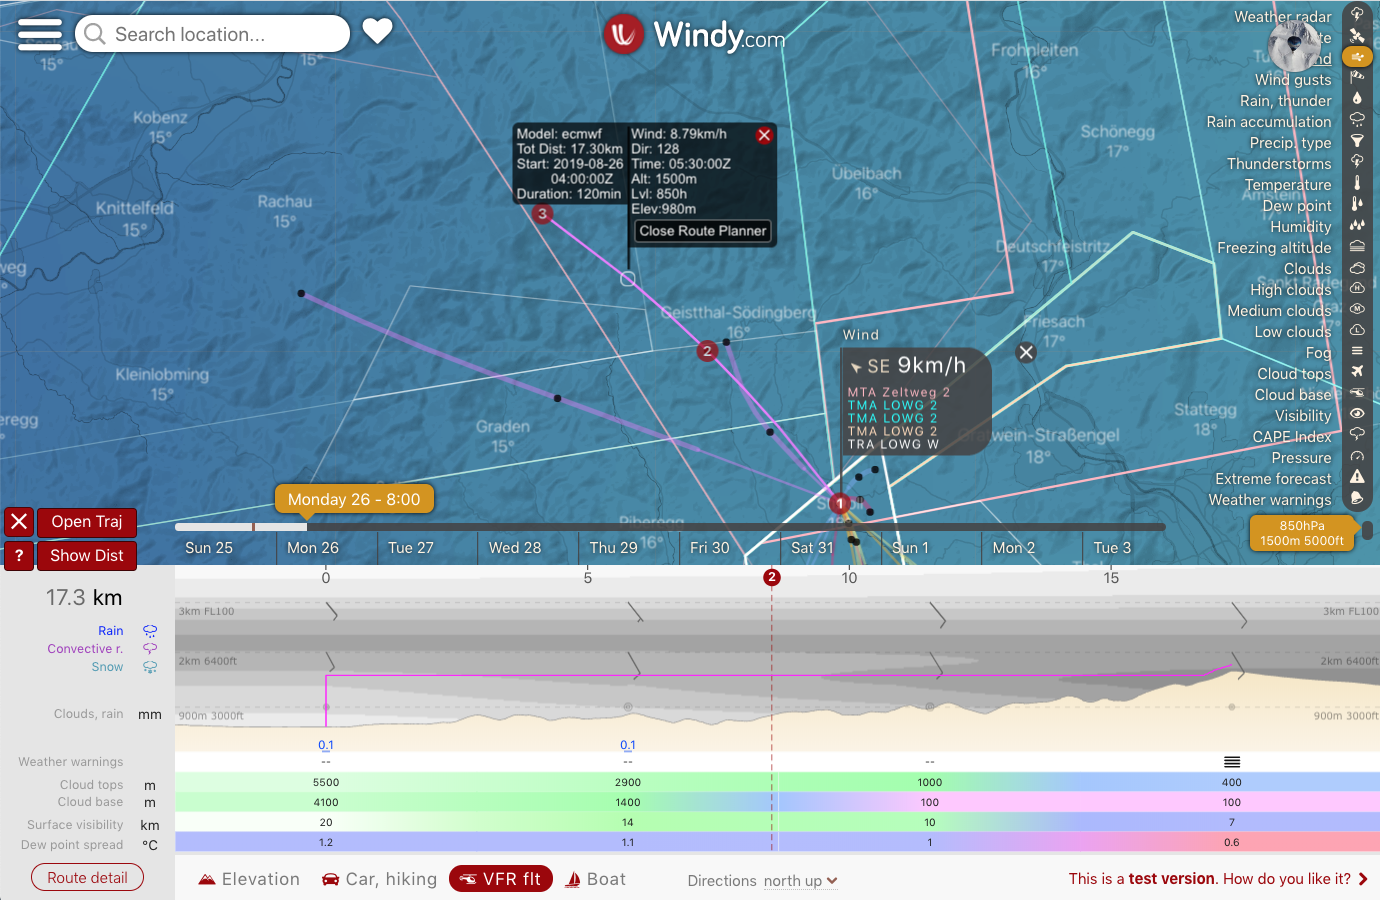
Click on an ECMWF forecast track, then click on the “Route Planner” button. This will split the screen vertically and the atmosphere cross section along this track comes up in the bottom half:
Update: Route Planner just was improved (Airgram and IFR view added) and that update also shows if Route Planner is activated via the traj.
Big Fat Warning: See the “Directions north up” dropdown near the bottom of the last screenshot? There are two more options which are seriously confusing with respect to wind barbs: “from left to right” and “from bottom to top”.
You want to set this dropdown to “north up” or the wind barbs will be relative to your course(!!). That possibly makes sense for airplanes but not for balloon rides.
How would you distribute windy trajectories during weather briefings at balloon events? You did save the result as GPX file. And now what?
Paper: meh. Display screenshot on projector? confusing spaghetti. Post a KML or GPX file on a whatsapp group? hardly anybody could open such files on their mobiles and pads.
Pretty easy with GPSVisualizer:
upload the GPX file so it is Internet-accessible and note its URL (e.g. as a WordPress media file – here’s an example GPX file for you to play with)
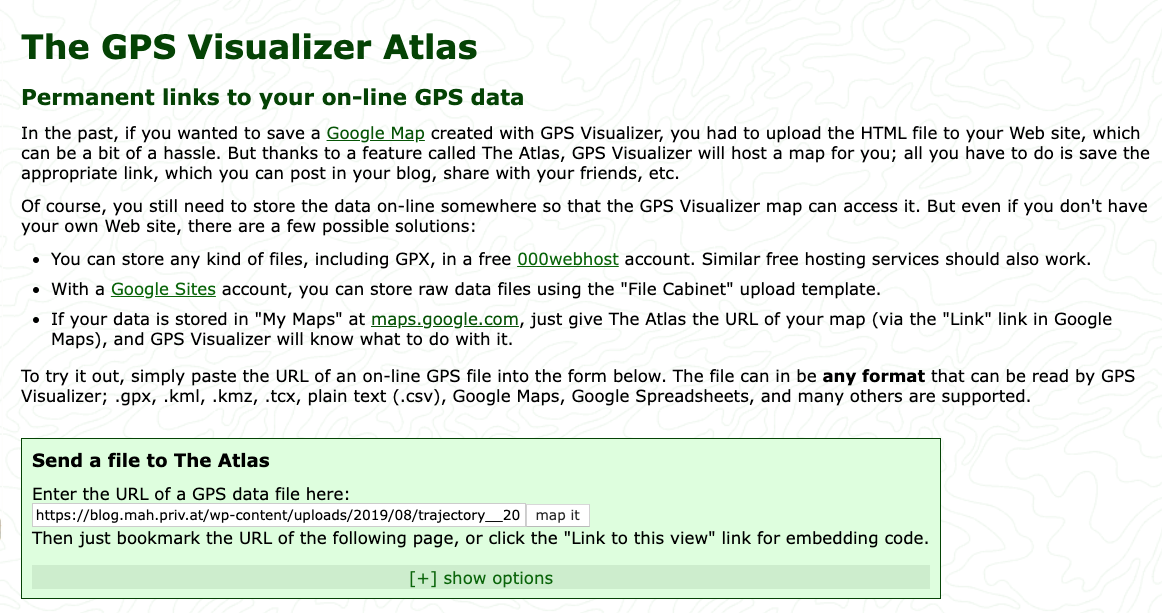
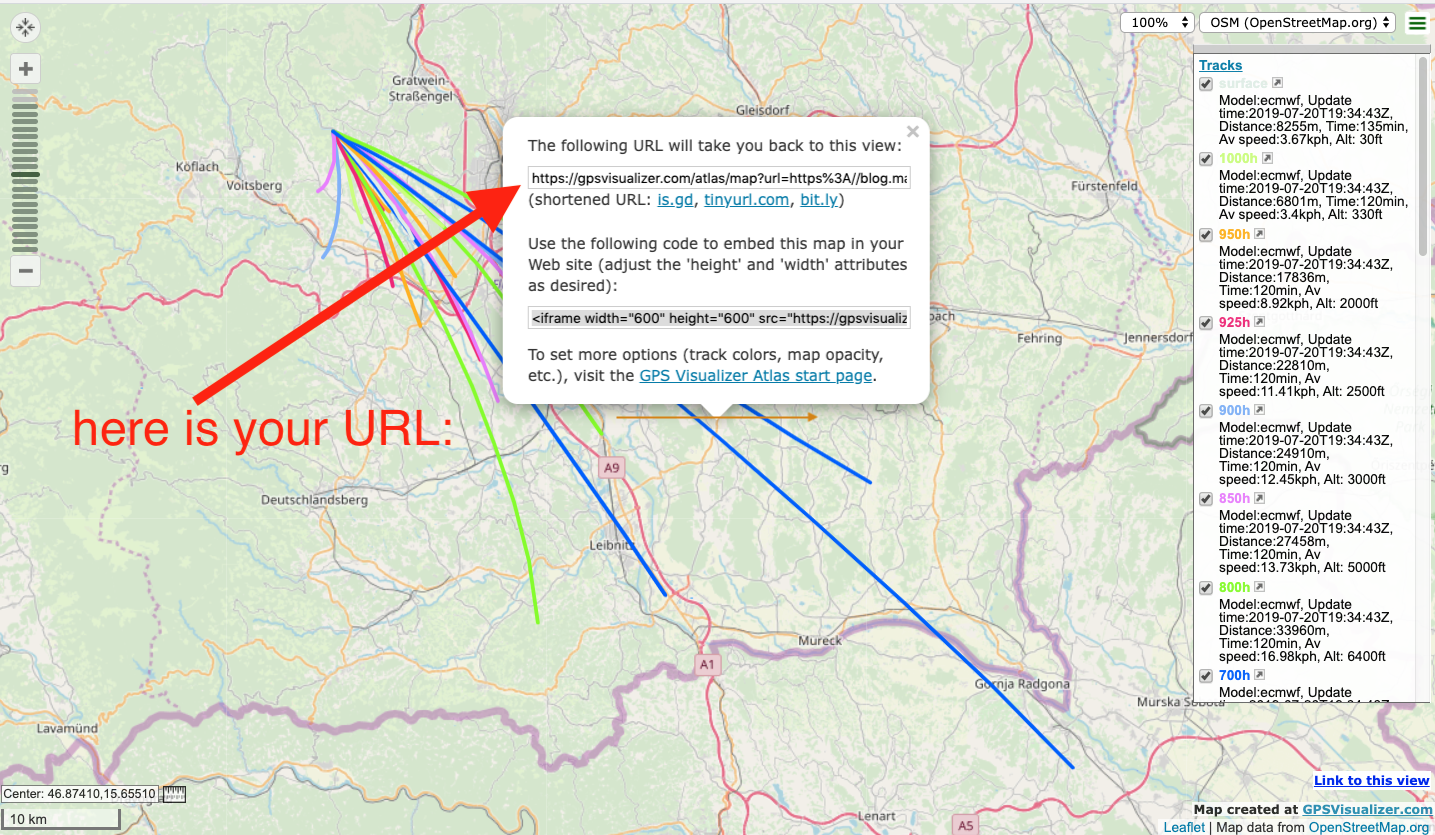
goto GPSVisualizer.com and paste the URL of the GPX file into the “Send a file to The Atlas” field:
GPSVisualizer Atlas page
hit the “map it” button – you should see something like this:
That’s thew view you’d want to distribute – people can pan and zoom around, and select/deselect heights and models in the trajectory set.
To create a URL for this view:
Click the blue “Link to this view” field at the right bottom:
Edit: There is currently a minor bug in the GPSvisualizer web service – uploaded tracks vanish after a certain time, and the message ‘File … contains no usable data’ is displayed.
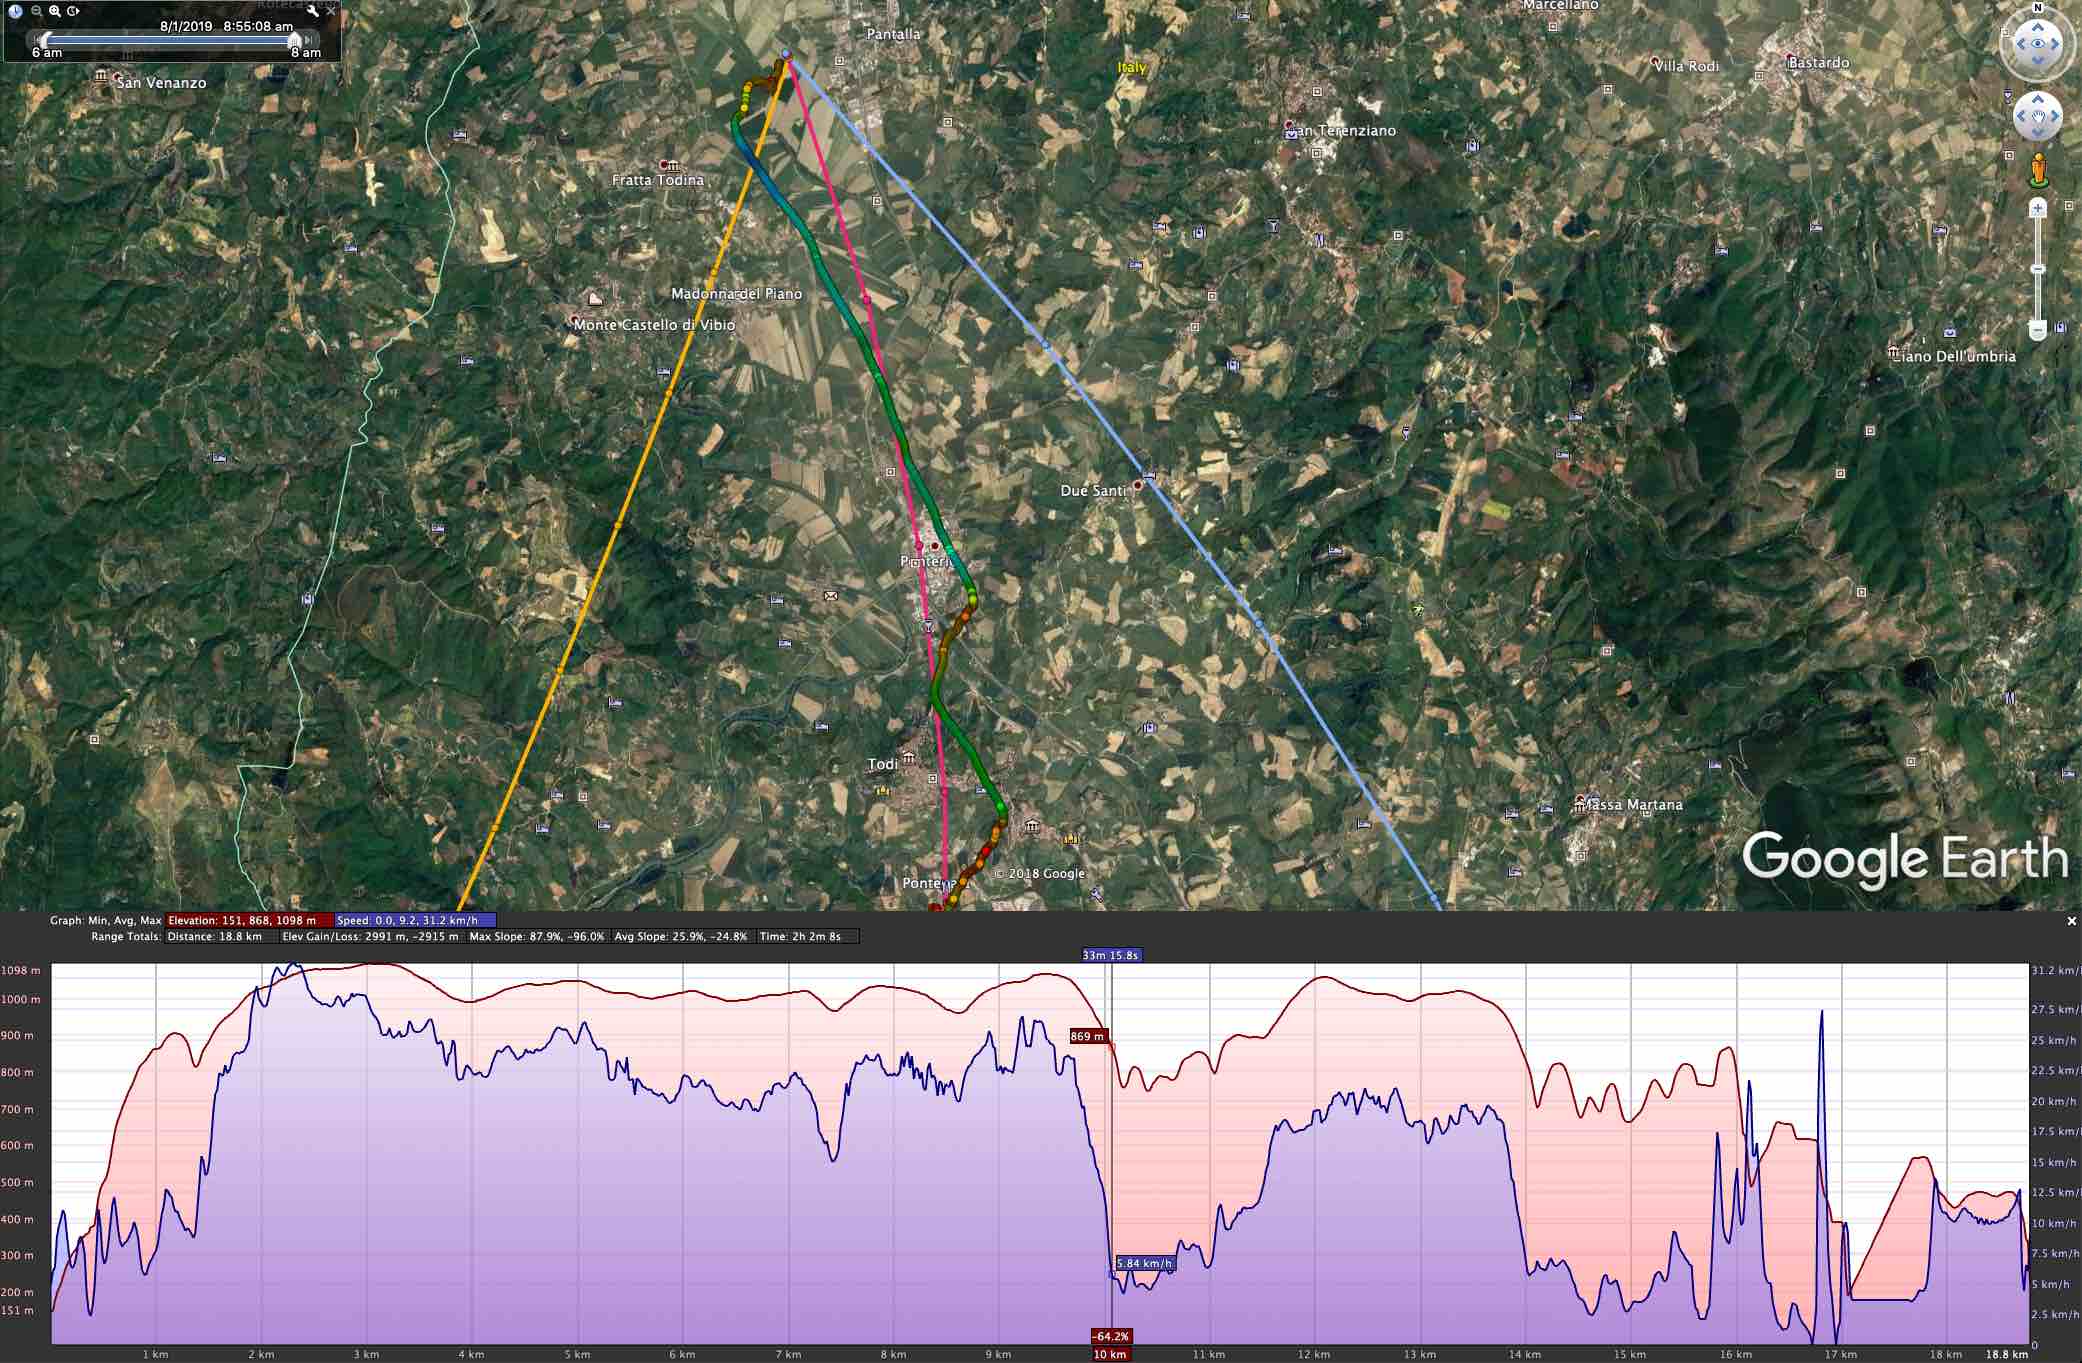
Most of the flight was between 800m and 1000m altitude, so I selected the 2000ft (amber), 2500ft (red) and 3000ft (blue) trajectories.
The ECMWF model had the best match, so only ECMWF forecasts are shown.
The flight started on the valley floor, within an inversion and a slight northerly flow.
The match is excellent – especially with the 2500ft trajectory, and the descent phases around 11km and 15km into the flight show the northeasterly flow forecast by the amber line.
As to be expected, the track is shorter than the forecast – slightly more than half the distance.
my gut feeling after comparing several forecasts to tracks: ECMWF wind speed forecasts are a tad on the high side.
windy.com is a phenomenal resource for weather forecasting. It’s less of a “will it rain at X by Y” type app but rather a data viewer for many different layers of information – you will have to draw your own conclusions. It also sports a variety of forecast models (among them the $$$ ECMWF) – for free. And it supports user-written plugins for specific purposes, which has unleashed a lot of creativity by weather-affine geeks.
For balloonists, the traj plugin is very useful – it can create tracks to answer the question “If I start at X and fly level in altitude Y at time Z, which track would I fly?”. And it can answer this according to several weather models – in Europe that’d be ECMWF, GFS and ICON-EU.
Here’s a short how-to for generating trajectories:
The traj plugin currently only works on desktop browsers – not (yet) on mobiles
The plugin must be explicitly loaded after pointing your browser to https://www.windy.com/ : click on the top left “Hamburger” (three horizontal bars) icon. In the dropdown, click “Install Windy plugin” and scroll down until you find the “Trajectory” plugin – then click on “Open”.
two windows will appear – one with explanations and one for parameters.
Select altitudes and duration in the parameter window.
Set a start time using the time selector at the bottom of the screen.
Select a model (ICON, ECMWF or GFS) in the right bottom model selector.
Choose a start location – either by clicking on the map window (the “picker”) or choosing a favorite by clicking the heart icon in the parameter window which will present a dropdown of your favorite locations
click “Start” – which changes the label on this button to “Stop”
the progress can be seen on-screen as the curves are drawn
the black bullets denote hourly intervals
Click on the lines, or the bullets for detail information (time, speed, model, model generation time etc)
when the plugin is done, you can download the trajectories as GPX files by clicking “Save”
Trajectory tutorial video (slightly out of date)
Advanced features include:
simulation of ascent and descent – if set to zero, just level flight will be simulated
backwards trajectories – those answer the question “If I want to go to location X, where do I need to start?”
duration of the trajectory: up to 240 hours – useful for gas balloon flights